
- Title
-
A New Pentafluorothio-Substituted Curcuminoid with Superior Antitumor Activity
- Authors
- Linder, B., Köhler, L.H.F., Reisbeck, L., Menger, D., Subramaniam, D., Herold-Mende, C., Anant, S., Schobert, R., Biersack, B., Kögel, D.
- Source
- Full text @ Biomolecules
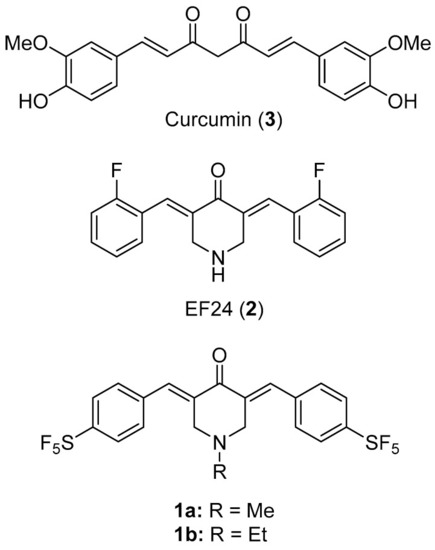
Structures of curcumin (3) and the curcuminoids EF24 (2), 1a and 1b. |
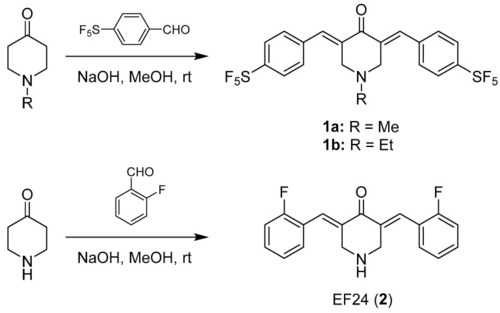
Synthesis of curcuminoids 1a, 1b and EF24 (2). rt: room temperature. |

(A) Antiangiogenic effect of 1a, 1b, 2 (10 µM) or vehicle DMSO in Zebrafish embryos after 48 h exposure. Images are representative of at least 20 identically treated fish. (B) The area of sub-intestinal veins (SIV) depicted as the mean ± SD of at least 20 embryos (n = 20 per group). *: p < 0.05; ****: p < 0.0001, One-way ANOVA with Dunnett’s multiple comparison test (GraphPad Prism 7). |

(A) Effect of 1a, 1b and 2 (1 µM) on the cell-cycle of HT-29 colorectal adenocarcinoma cells after 24h of treatment. Negative controls were treated with an equivalent amount of solvent (DMSO). Box-plot of the quantification (mean ± SD) of the cell cycle distribution of HT-29 cells after treatment with 1a, 1b or 2 of three independent assays. The measurements were performed in triplicate and quoted as means ± SD (n = 9 per group). (B) Levels of reactive oxygen species (ROS) in HT-29 colon adenocarcinoma cells after treatment with 1a, 1b and 2 (0.5, 1, 2 µM) for 1 h determined by fluorescence-based DCFH-DA assay. The values are mean values ± SD from at least five independent experiments with negative control treated with an equivalent amount of solvent and set to 100% (dashed line; ctrl) (n = 5 per group). *: p < 0.05; **: p < 0.01; ***: p < 0.001; ****: p < 0.0001 against control for each cell cycle phase, Two-way ANOVA with Dunnett’s multiple comparison test (GraphPad Prism 7). |

(A) Concentration-dependent effect of 1a, 1b and 2 (1 and 2 µM) on the actin cytoskeleton of HT-29 colon adenocarcinoma cells. An equivalent amount of solvent (DMSO) served as negative control. Images are representative of at least three independent experiments. Magnification 630× (n = 3 per group). (B) Substance 1a (1 µM) causes blebbing (I., bright field), nuclei fragmentation (II., DAPI staining) and different types of actin reorganization (III. and IV., phalloidin staining) such as stress fiber formation, actin clustering, cell rounding and formation of apoptopodia-like structures in HT-29 cells (n = 3 per group). |
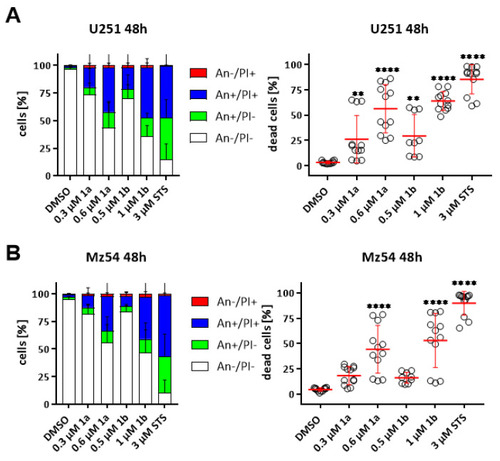
Concentration-dependent induction of cell death in conventional GBM cell lines U251 and Mz54 after treatment for 48 h. FACS-based detection of Annexin V (An)- and Propidium Iodide (PI)-stained cells. (A,B) Summary displaying (left) the different cell populations of (A) U251) and (B) Mz54 after treatment as indicated as stacked bar graph with SEM, and (right) the percentage of dead cells (100%—An−/PI−) as a point-plot with the mean (+/− SEM) as a horizontal red line. 3 µM Staurosporine (STS) served as a positive control. (C and D). The data are a summary of at least three experiments performed in triplicates (n = 9–12 per group). **: p < 0.01; ****: p < 0.0001, One-Way ANOVA with Dunnett’s multiple comparison test (GraphPad Prism 7). |

Concentration-dependent decrease in cell viability of the conventional GSC sphere cultures GS-5, NCH644 and the primary culture 17/02. MTT-assay of (A,B) GS-5, (C,D) NCH644 and (E,F) 17/02 GSCs treated for (A,C,E) 48 h or (B,D,F) 72 h with compounds as indicated. The data were normalized from highest (100%) to lowest (0%) and plotted against the log-dose of the compounds. To calculate the IC50-values (Table 4) a curve-fitting was done using the function “log(inhibitor) vs. normalized response Variable slope” without constraints (GraphPad Prism 7). As positive controls, the cells were treated with 20 µM Curcumin (CCM) or solvent (DMSO) or 2.5 µM arsenic trioxide (As2O3, ATO) or solvent (H2O) for the same amount of time (Inserts in A to D). The data presented is the summary of three independent experiments performed in 6 replicates (n = 18 per group). **: p < 0.01; ****: p < 0.0001; Unpaired t test with Welch’s Correction (GraphPad Prism 7). |

Reduced stemness of the GSC cultures GS-5, NCH644 and the primary culture 17/02. Log-fraction plot of the limited dilution model of data from (A) GS-5, (B) NCH644 GSCs and (C) the primary culture 17/02 treated with solvent (DMSO, black), the IC25 (red) and IC50 (green) of 1a and the IC25 (dark blue) or IC50 (light blue) of 1b for 10 days and analyzed using ELDA software [18]. The data are the summary of 2 experiments performed in 12 replicates (n = 24 per group). *: p < 0.05; **: p < 0.01; ****: p < 0.0001; Pairwise Test for Differences using Chi-square-test (ELDA). The estimated stem-cell frequency (number of cells needed to form a sphere) is given in Table 3. |