
|
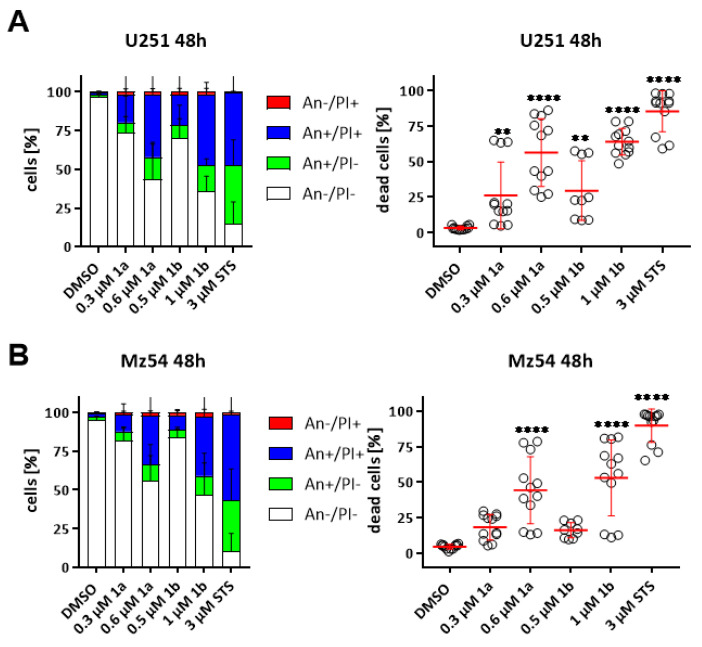
Figure 6
Concentration-dependent induction of cell death in conventional GBM cell lines U251 and Mz54 after treatment for 48 h. FACS-based detection of Annexin V (An)- and Propidium Iodide (PI)-stained cells. (A,B) Summary displaying (left) the different cell populations of (A) U251) and (B) Mz54 after treatment as indicated as stacked bar graph with SEM, and (right) the percentage of dead cells (100%—An−/PI−) as a point-plot with the mean (+/− SEM) as a horizontal red line. 3 µM Staurosporine (STS) served as a positive control. (C and D). The data are a summary of at least three experiments performed in triplicates (n = 9–12 per group). **: p < 0.01; ****: p < 0.0001, One-Way ANOVA with Dunnett’s multiple comparison test (GraphPad Prism 7).