
|
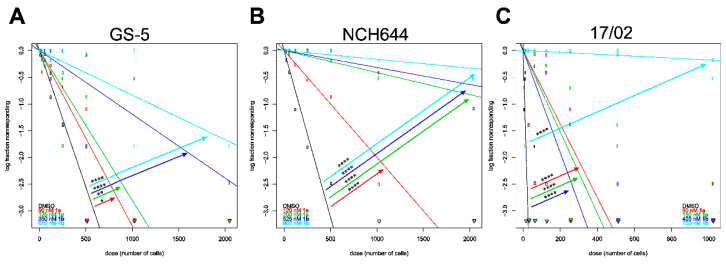
Figure 8
Reduced stemness of the GSC cultures GS-5, NCH644 and the primary culture 17/02. Log-fraction plot of the limited dilution model of data from (A) GS-5, (B) NCH644 GSCs and (C) the primary culture 17/02 treated with solvent (DMSO, black), the IC25 (red) and IC50 (green) of 1a and the IC25 (dark blue) or IC50 (light blue) of 1b for 10 days and analyzed using ELDA software [18]. The data are the summary of 2 experiments performed in 12 replicates (n = 24 per group). *: p < 0.05; **: p < 0.01; ****: p < 0.0001; Pairwise Test for Differences using Chi-square-test (ELDA). The estimated stem-cell frequency (number of cells needed to form a sphere) is given in Table 3.