
- Title
-
Novel zebrafish polycystic kidney disease (PKD) models reveal functions of the Hippo pathway in renal cystogenesis
- Authors
- Ren, Z., Zhang, Z., Liu, T.M., Ge, W.
- Source
- Full text @ Dis. Model. Mech.
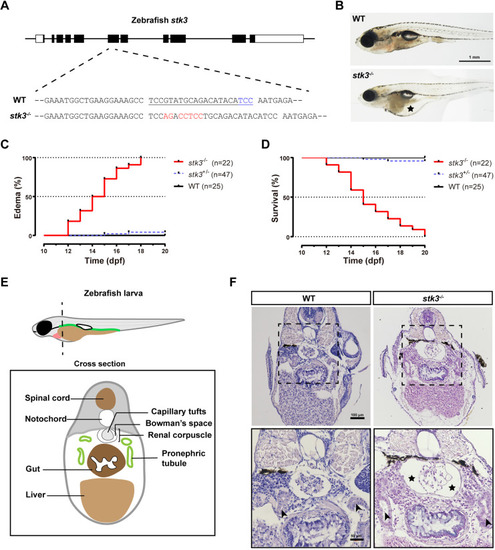
stk3 mutation induced edema, glomerular cyst and pronephric tubule dilation in zebrafish. (A) Schematic diagram of stk3 gene structure and CRISPR/Cas9-induced mutation. The CRISPR site was designed to target the 6th exon. A mutant line with a 5-bp insertion was generated for phenotype analysis. Filled boxes indicate coding regions and open boxes indicate untranslated regions. The underlined sequence is the CRISPR site, the protospacer adjacent motif (PAM) sequence is shown in blue, and the altered sequence is shown in red. (B) Morphology of larvae at 15 dpf. The asterisk indicates the edema. Scale bar: 1 mm. (C) Kaplan–Meier plots for the onset of edema in stk3−/− larvae and controls [wild-type (WT) and heterozygous siblings]. All the stk3−/− larvae exhibited edema during 12-18 dpf, with median onset time at 14.5 dpf. Statistical analysis was performed using log-rank (Mantel–Cox) test (P<0.001). (D) Kaplan–Meier plots for survival of stk3−/− larvae and controls (WT and heterozygous siblings). No stk3−/− larvae could survive beyond 20 dpf, with median survival time at 15 dpf. Statistical analysis was performed using log-rank (Mantel–Cox) test (P<0.001). (E) Schematic diagram of larval cross section. (F) H&E staining of paraffin-embedded sections of stk3−/− larvae and WT siblings at 15 dpf. The boxed areas are shown enlarged below. stk3−/− larvae exhibited glomerular cysts with enlarged Bowman's space (asterisks) and pronephric tubule (arrowheads) dilation. Scale bars: 100 μm (top) and 50 μm (bottom). |
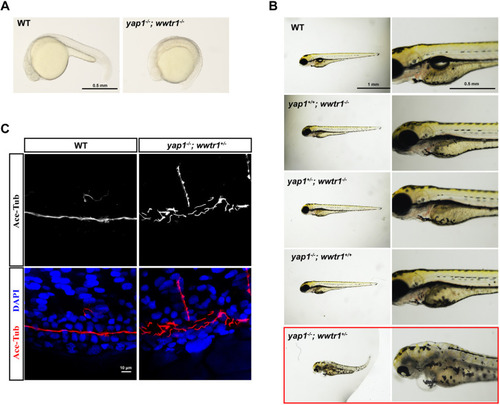
Functional redundance of yap1 and wwtr1 in pronephros development at embryonic stage. (A) Phenotype analysis of yap1−/−;wwtr1−/− embryos at 20 hpf. The embryos of yap1−/−;wwtr1−/− double mutant exhibited no tail extension. Scale bar: 0.5 mm. (B) Phenotype analysis of embryos with different genotypes produced by yap1+/−;wwtr1+/− in-cross. Scale bars: 1 mm (left) and 0.5 mm (right). (C) Whole-mount immunofluorescent staining of acetylated tubulin (red) and DAPI (blue) in yap1−/−;wwtr1+/− embryo and WT embryo at 48 hpf. Z projection of 0.5 μm optical section stacks. Scale bar: 10 μm. |
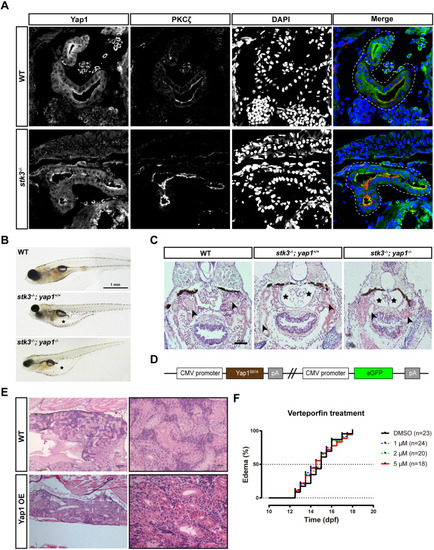
Functional analysis of Yap1 in zebrafish stk3−/− mutants. (A) Immunofluorescent staining of Yap1 and PKCζ in cryostat sections of stk3−/− larvae and WT siblings at 12 dpf. DAPI stains nuclei. The merged images are presented with Yap1 staining in green, PKCζ in red and DAPI in blue. Dashed line loops indicate the renal tubules. Scale bar: 20 μm. (B) Morphology of larvae at 15 dpf. Asterisks indicate the edema. Scale bar: 1 mm. (C) H&E staining of paraffin sections of larvae at 15 dpf. stk3−/−;yap1−/− double mutants exhibited the same phenotype as stk3−/− single mutants. Enlarged Bowman's space (asterisks) and pronephric tubule (arrowheads) dilation could be detected. Scale bar: 50 μm. (D) Schematic diagram of the expression plasmid for Yap1 OE fish line. (E) H&E staining of paraffin sections of adult kidneys at 90 dpf. No obvious difference between Yap1 OE fish and WT controls could be detected. Scale bars: 100 μm (left) and 20 μm (right). (F) Kaplan–Meier plots for the onset of edema in stk3−/− larvae under verteporfin treatment. Treatment with a different dose of verteporfin (1, 2 and 5 μM) did not influence the onset of edema compared to DMSO control. Analysis with log-rank (Mantel–Cox) test showed no statistical significance. |

The pronephric phenotypes of stk3−/− mutants involve activation of Wwtr1. (A) Immunofluorescent staining of Wwtr1, PKCζ and DAPI in cryostat sections of stk3−/− larvae and WT siblings at 12 dpf. Merged images are presented with Wwtr1 staining in green, PKCζ in red and DAPI in blue. Dashed line loops indicate the renal tubules. The arrowheads indicate the nuclear accumulation of Wwtr1. Scale bar: 20 μm. (B) Morphology of larvae at 21 dpf. As no stk3−/−;wwtr1+/+ fish could be found at 21 dpf, we presented stk3−/−;wwtr1+/+ fish at 15 dpf for comparison. Asterisks indicate the edema. Scale bar: 1 mm. (C) Kaplan–Meier plot for the onset of edema in progeny of stk3+/−;wwtr1+/− in-cross. stk3−/−;wwtr1−/− double mutants exhibited delayed edema onset compared to stk3−/− single mutants. Statistical analysis was performed using log-rank (Mantel–Cox) test (P<0.001). (D) H&E staining of paraffin sections of larvae at 21 dpf. stk3−/−;wwtr1−/− double mutants exhibited mild glomerular cyst with enlarged Bowman's space (asterisks) and pronephric tubule (arrowheads) dilation. As no stk3−/−;wwtr1+/+ fish could be found at 21 dpf, we presented stk3−/−;wwtr1+/+ fish at 15 dpf for comparison. Scale bar: 50 μm. (E) Statistical analysis of relative renal corpuscle areas [renal corpuscle area/(trunk width)2]. stk3−/−;wwtr1−/− double mutants exhibited significantly smaller renal corpuscles than stk3−/− single mutants (stk3−/−;wwtr1+/+). Different letters indicate statistical significance by one-way ANOVA, mean±s.e.m. [n=10 stk3+/+;wwtr1+/+ (n=5 at 15 dpf, n=5 at 21 dpf), n=7 stk3−/−;wwtr1+/+ (15 dpf), n=6 stk3−/−;wwtr1−/− (21 dpf); as the edema onset times were different in stk3−/−;wwtr1+/+ and stk3−/−;wwtr1−/− lines, we sampled the fish at their median edema onset times]. a.u., arbitrary units. |
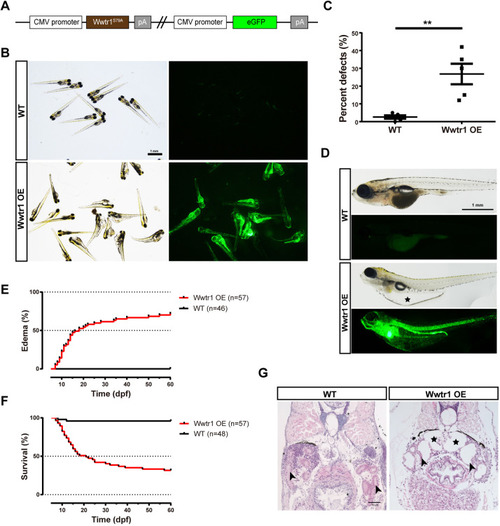
Overexpression of Wwtr1 in zebrafish induces polycystic kidney disease (PKD). (A) Schematic diagram of the expression plasmid for the Wwtr1 overexpression (Wwtr1 OE) fish line. (B) Morphology and fluorescent signal of larvae at 3 dpf. Scale bar: 1 mm. (C) Statistical analysis of embryonic defects in Wwtr1 OE fish and WT fish. **P<0.01 by unpaired two-tailed Student's t-test, mean±s.e.m. (n=5). (D) Morphology of larvae at 18 dpf. The asterisk indicates the edema. Scale bar: 1 mm. (E) Kaplan–Meier plots for the onset of edema in Wwtr1 OE and WT fish. The median time of onset of edema was 18 dpf. Statistical analysis was performed using log-rank (Mantel–Cox) test (P<0.001). (F) Kaplan–Meier plots for survival of Wwtr1 OE and WT fish. The median survival time was 21 dpf. Statistical analysis was performed using log-rank (Mantel–Cox) test (P<0.001). (G) H&E staining of paraffin sections of Wwtr1 OE and WT fish at 18 dpf. Wwtr1 OE fish exhibited glomerular cyst with enlarged Bowman's space (asterisks) and pronephric tubule (arrowheads) dilation. Scale bar: 50 μm. |
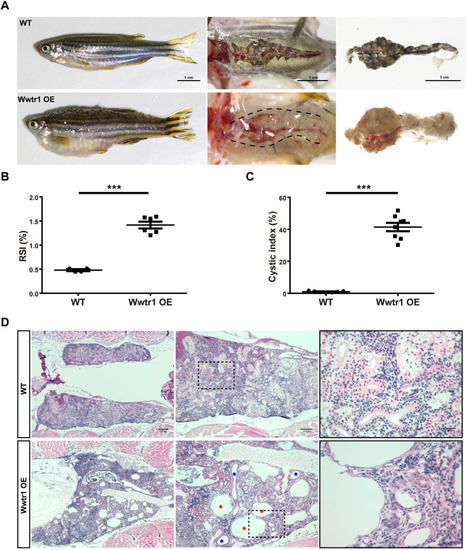
Overexpression of Wwtr1 in zebrafish induces PKD (continued). (A) Body and kidney morphology of adult fish at 90 dpf. Wwtr1 OE fish exhibited edema and abnormally larger kidneys compared with WT fish. Scale bar: 1 cm. (B) Statistical analysis of reno-somatic index (RSI; kidney weight/body weight) of Wwtr1 OE and WT fish (***P<0.001 by unpaired two-tailed Student's t-test, mean±s.e.m., n=6 WT, n=4 Wwtr1 OE). The Wwtr1 OE fish had significantly larger kidneys than WT fish. (C) Statistical analysis of cystic index (cystic area/total kidney area) of Wwtr1 OE and WT fish (***P<0.001 by unpaired two-tailed Student's t-test, mean±s.e.m., n=7 WT, n=8 Wwtr1 OE). (D) H&E staining of paraffin sections of adult kidneys at 90 dpf. Wwtr1 OE fish exhibited PKD. Red asterisks indicate glomerular cysts and blue asterisks indicate renal tubular cysts. The boxed areas are shown enlarged on the right. Scale bars: 200 μm (left), 100 μm (middle) and 20 μm (right). |
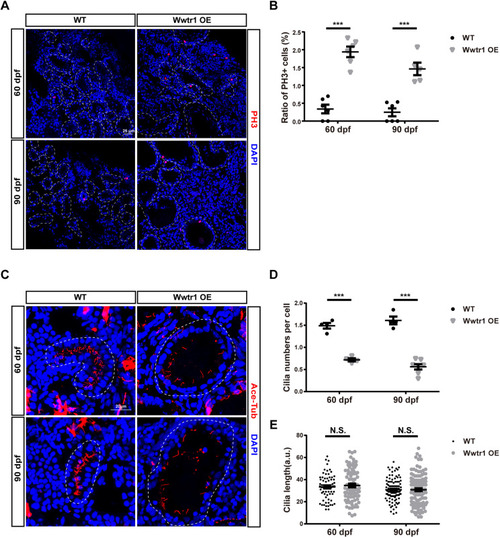
Wwtr1 OE fish exhibit hyperproliferation of renal tubular epithelial cells and fewer cilia in renal tubules. (A) Immunofluorescent staining of cryostat sections of kidneys in adult Wwtr1 OE and WT fish at 60 dpf and 90 dpf labeling PH3 (red) and DAPI (blue). Dashed line loops represent renal tubules. Scale bar: 25 μm. (B) Statistical analysis of the ratio of PH3+ cells in the renal tubules of Wwtr1 OE and WT fish [***P<0.001 by unpaired two-tailed Student's t-test, mean±s.e.m., n=6 WT (60 dpf), n=6 Wwtr1 OE (60 dpf), n=6 WT (90 dpf), n=5 Wwtr1 OE (90 dpf)]. (C) Immunofluorescent staining of acetylated tubulin (red) and DAPI (blue) in cryostat sections of kidneys of adult Wwtr1 OE and WT fish at 60 dpf and 90 dpf. Z projection of 0.5 μm optical section stacks. Dashed line loops represent renal tubules. Scale bar: 20 μm. (D) Statistical analysis of cilia numbers in renal tubules of Wwtr1 OE and WT fish. The cilia numbers in the whole renal tubules were counted and divided by the cell numbers [***P<0.001 by unpaired two-tailed Student's t-test, mean±s.e.m., n=4 WT (60 dpf), n=4 Wwtr1 OE (60 dpf), n=4 WT (90 dpf), n=7 Wwtr1 OE (90 dpf)]. (E) Statistical analysis of cilia lengths in renal tubules of Wwtr1 OE and WT fish. N.S., not significant by unpaired two-tailed Student's t-test, mean±s.e.m. [n=70 WT (60 dpf), n=78 Wwtr1 OE (60 dpf), n=105 WT (90 dpf), n=112 Wwtr1 OE (90 dpf)]. |
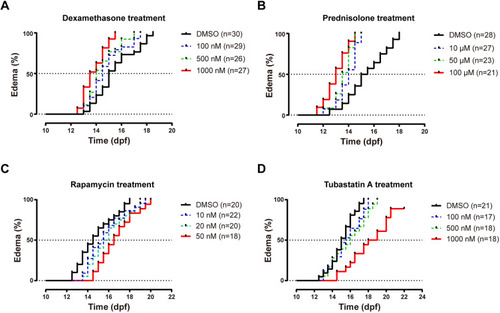
Treatment of Stk3-deficient mutant zebrafish for edema. None of the drugs in the study had obvious effects on edema onset in stk3+/+ controls. (A) Dose response of dexamethasone-induced early onset of the edema phenotype in stk3−/− larvae. The median times of onset of edema were 14.5 dpf (100 nM), 14.0 dpf (500 nM) and 13.5 dpf (1000 nM) compared to 15.0 dpf in DMSO control. Statistical analysis was performed using log-rank (Mantel–Cox) test (P<0.001). (B) Dose response of prednisolone-induced early onset of the edema phenotype in stk3−/− larvae. The median times of onset of edema were 14.0 dpf (10 μM), 13.5 dpf (50 μM) and 13.0 dpf (100 μM) compared to 15.0 dpf in DMSO control. Statistical analysis was performed using log-rank (Mantel–Cox) test (P<0.001). (C) Delay of edema onset by rapamycin treatment. The median times of onset of edema were 15.5 dpf (10 nM), 15.75 dpf (20 nM) and 16.5 dpf (50 nM) compared to 14.5 dpf in DMSO control. Statistical analysis was performed using log-rank (Mantel–Cox) test (P<0.05). (D) Delay of edema onset by tubastatin A treatment. The median onset points were 15.5 dpf (100 nM), 16.0 dpf (500 nM) and 18.5 dpf (1000 nM) compared to 15.0 dpf in DMSO control. Statistical analysis was performed using log-rank (Mantel–Cox) test (P<0.001). |