
|
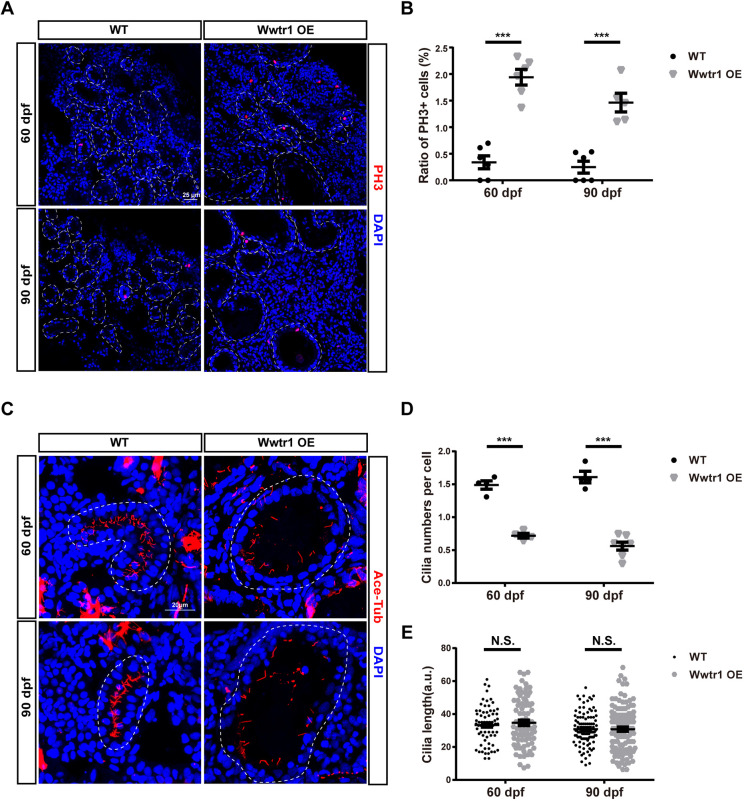
Fig. 7.
Wwtr1 OE fish exhibit hyperproliferation of renal tubular epithelial cells and fewer cilia in renal tubules. (A) Immunofluorescent staining of cryostat sections of kidneys in adult Wwtr1 OE and WT fish at 60 dpf and 90 dpf labeling PH3 (red) and DAPI (blue). Dashed line loops represent renal tubules. Scale bar: 25 μm. (B) Statistical analysis of the ratio of PH3+ cells in the renal tubules of Wwtr1 OE and WT fish [***P<0.001 by unpaired two-tailed Student's t-test, mean±s.e.m., n=6 WT (60 dpf), n=6 Wwtr1 OE (60 dpf), n=6 WT (90 dpf), n=5 Wwtr1 OE (90 dpf)]. (C) Immunofluorescent staining of acetylated tubulin (red) and DAPI (blue) in cryostat sections of kidneys of adult Wwtr1 OE and WT fish at 60 dpf and 90 dpf. Z projection of 0.5 μm optical section stacks. Dashed line loops represent renal tubules. Scale bar: 20 μm. (D) Statistical analysis of cilia numbers in renal tubules of Wwtr1 OE and WT fish. The cilia numbers in the whole renal tubules were counted and divided by the cell numbers [***P<0.001 by unpaired two-tailed Student's t-test, mean±s.e.m., n=4 WT (60 dpf), n=4 Wwtr1 OE (60 dpf), n=4 WT (90 dpf), n=7 Wwtr1 OE (90 dpf)]. (E) Statistical analysis of cilia lengths in renal tubules of Wwtr1 OE and WT fish. N.S., not significant by unpaired two-tailed Student's t-test, mean±s.e.m. [n=70 WT (60 dpf), n=78 Wwtr1 OE (60 dpf), n=105 WT (90 dpf), n=112 Wwtr1 OE (90 dpf)].