
Fig. 6.
- ID
- ZDB-FIG-211118-107
- Publication
- Ren et al., 2021 - Novel zebrafish polycystic kidney disease (PKD) models reveal functions of the Hippo pathway in renal cystogenesis
- Other Figures
- All Figure Page
- Back to All Figure Page
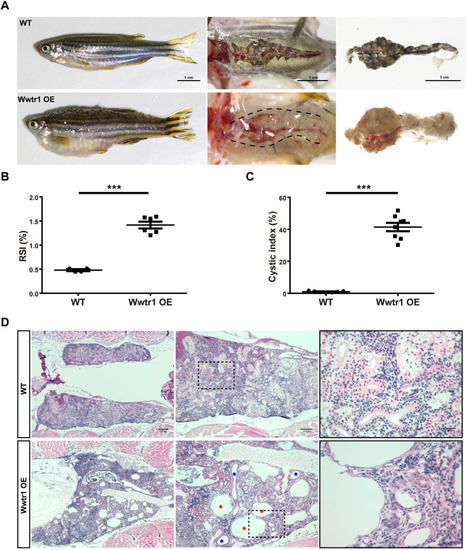
Overexpression of Wwtr1 in zebrafish induces PKD (continued). (A) Body and kidney morphology of adult fish at 90 dpf. Wwtr1 OE fish exhibited edema and abnormally larger kidneys compared with WT fish. Scale bar: 1 cm. (B) Statistical analysis of reno-somatic index (RSI; kidney weight/body weight) of Wwtr1 OE and WT fish (***P<0.001 by unpaired two-tailed Student's t-test, mean±s.e.m., n=6 WT, n=4 Wwtr1 OE). The Wwtr1 OE fish had significantly larger kidneys than WT fish. (C) Statistical analysis of cystic index (cystic area/total kidney area) of Wwtr1 OE and WT fish (***P<0.001 by unpaired two-tailed Student's t-test, mean±s.e.m., n=7 WT, n=8 Wwtr1 OE). (D) H&E staining of paraffin sections of adult kidneys at 90 dpf. Wwtr1 OE fish exhibited PKD. Red asterisks indicate glomerular cysts and blue asterisks indicate renal tubular cysts. The boxed areas are shown enlarged on the right. Scale bars: 200 μm (left), 100 μm (middle) and 20 μm (right). |