
- Title
-
Modulation of bioelectric cues in the evolution of flying fishes
- Authors
- Daane, J.M., Blum, N., Lanni, J., Boldt, H., Iovine, M.K., Higdon, C.W., Johnson, S.L., Lovejoy, N.R., Harris, M.P.
- Source
- Full text @ Curr. Biol.

Evolution of fin allometry and gliding behavior in Beloniformes
(A) Lateral and dorsal views of a flying fish, Cypselurus callopterus, highlighting elongated pectoral (black arrowhead) and pelvic fins (white arrowhead) that act as an airfoil to enable aerial gliding behavior. The asymmetry of the caudal fin (hypocercal) aids in above-water propulsion (gray arrowhead). (B) Static allometry of pectoral fins in flying fishes (Exocoetidae; C. furcatus, E. volitans, and H. rondeleti) compared to sauries and needlefish (B. belone and S. marina) and halfbeaks (H. unifasciatus and H. brasiliensis). The “flying halfbeaks” (E. velox and O. micropterus) also exhibit aerial gliding behavior and have an intermediate pectoral fin length relative to the fishes of Exocoetidae. (C) Phylogeny of the beloniforms sequenced in this study. ‡ indicates lineages of flying halfbeak. All nodes were supported with a quadpartition posterior probability of 1.00. |

Convergent and ancestral genetic signatures in fin and limb genes in the evolution of gliding beloniforms
(A) Comparison of average relative evolutionary rate between the gliding and non-gliding beloniform nodes across specific gene ontology terms across the beloniform phylogeny (gliding fish lineages highlighted in red). Histograms represent the distribution across each node in the phylogeny of the average relative evolutionary rate for all genes within a given gene ontology term. The mean of the average relative evolutionary rates in gliding and non-gliding beloniform nodes is denoted at the base of each histogram. Significance (–log(q-value)) based on false discovery rate (FDR)-corrected p values from a Wilcoxon signed-rank test of differences between the mean relative evolutionary rate of gliding beloniforms compared to non-gliding beloniform branches. For full enrichment data, see Data S1F. (B) Intersection of molecular convergence and changes to evolutionary rate in key fin-associated genes, as defined from genetic screens and gene ontology sets, at key nodes in the Beloniformes phylogeny associated with flight. See Data S1H for full gene list. We detected parallel amino acid substitutions (Data S1G) and convergent changes to relative evolutionary rate (Data S1I) in gliding beloniforms. We further identified sequence elements under accelerated or constrained evolution in the ancestral flying fish lineage (Exocoetidae; Data S1J). (C) Elevated relative evolutionary rate in lat4a in gliding beloniforms. Each dot represents a node in the beloniform phylogeny. *p < 0.05 for two-tailed t test. White arrowhead indicates Parexocoetus brachypterus. Lat4a also has a phyloP acceleration p = 0.008 on the common ancestral node of flying fishes (Data S1J). (D) Convergent amino acid substitution in a highly conserved region of Lat4a through multiple codon mutations in flying fishes and flying halfbeaks. This substitution is found in both lineages of flying halfbeak and all flying fishes (Exocoetidae) with the exception of the sailfin flying fish, P. brachypterus, which has an elongated dorsal fin (gray arrowhead). See also S1 and S2. |
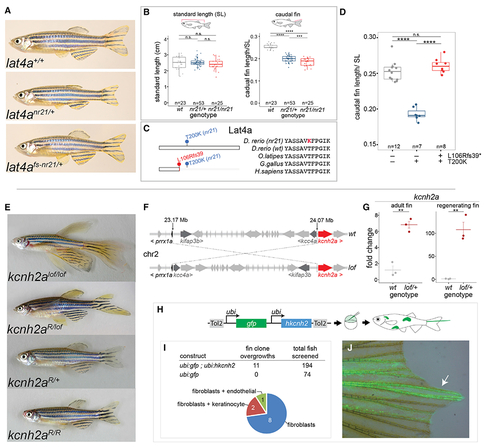
Identification of zebrafish mutants in potassium channels and amino acid transporters in the regulation of fin size
(A) Images of wild type, nr21 short fin mutant, and nr21 in cis frameshift revertant (L106Rfs39, nr21) zebrafish. (B) Comparison of fish standard length (SL) and caudal fin length in wild type, heterozygous (nr21/+), and homozygous (nr21/nr21) individuals. p values generated through Tukey’s HSD. ****adjusted p ≤ 0.0001 and ***adjusted p ≤ 0.001. n.s. indicates not significant. (C) Multiple sequence alignment of Lat4a showing the predicted T200K substitution of nr21 and location of frameshift reversion allele. (D) Caudal fin length normalized to fish SL in wild type, nr21, and revertant mutants. Schematic indicates location of mutations on Lat4a. ****Tukey’s HSD adjusted p ≤ 0.0001. (E) Revertant mutants of the zebrafish longfindt2 (lof) mutant obtained from a mutagenesis screen. Reversion alleles mapped to loss-of-function mutations in the voltage-gated potassium channel kcnh2a are shown. (F) Identified chromosomal inversion in lof. Note this inversion juxtaposes the regulatory region of prrx1a upstream of the kcnh2a transcription start site. For detailed positional mapping information, see Figure S3. (G) qRT-PCR showing upregulation of kcnh2a in adult and regenerating caudal fins of lof compared to wild type. Midline represents mean; errors bars represent ±1 SEM. (H) Mosaic overexpression assay to assess effect of hKCNH2 overexpression on fin growth. The plasmid is injected into single-cell zebrafish embryos with Tol2 transposase mRNA and is incorporated randomly into the genome, resulting in a mosaic patchwork of gene overexpression in the adult. (I) Number of overgrowths observed in injected zebrafish and marked cells underlying the overgrowth. (J) Example fin overgrowth showing GFP+ fibroblast clones within the overgrown fin rays (arrow). See also Figures S2 and S3. |

Intersection of bioelectric and Lat4a-mediated growth pathways is sufficient to phenocopy the evolved flying fish fin allometry
(A) Images from representative fish from a lat4anr21/+ × kcnh2alof/+ cross indicate lat4a is a fin suppressor of overgrowth caused by increased potassium channel function. Brackets indicate length of pectoral fin. Pectoral fins are outlined with dashed line. As in flying fishes, the nr21/lof trans-heterozygotes exhibit elongated paired fins and a hypocercal caudal fin. Asterisk (*) highlights hypocercal caudal fin. (B and C) Pectoral fin length (B) and caudal fin length (C) suppression of overgrowth in medial fin by lat4a mutation. In (B) and (C), length normalized by SL. (D) qRT-PCR of kcnh2a in pectoral and dorsal fins containing the lof inversion. Expression of kcnh2a was not detected (n.d.) in wild-type fins. Note, no significant change in expression of kcnh2a is observed in fins containing the nr21 mutation. Fold change relative to lof/+ is shown. (E) qRT-PCR of lat4a showing no significant difference in lat4a expression across fins and genotypes. Fold change relative to wild type is shown. In (D) and (E), midline represents mean; errors bars represent ±1 SEM. In (B)–(E), p values are generated through Tukey’s HSD. ****adjusted p ≤ 0.0001, **adjusted p ≤ 0.01. and **adjusted p ≤ 0.05. n.s. indicates not significant. |

ZFIN is incorporating published figure images and captions as part of an ongoing project. Figures from some publications have not yet been curated, or are not available for display because of copyright restrictions. PHENOTYPE:
|