
Fig. 3
- ID
- ZDB-FIG-221222-34
- Publication
- Daane et al., 2021 - Modulation of bioelectric cues in the evolution of flying fishes
- Other Figures
- All Figure Page
- Back to All Figure Page
Identification of zebrafish mutants in potassium channels and amino acid transporters in the regulation of fin size
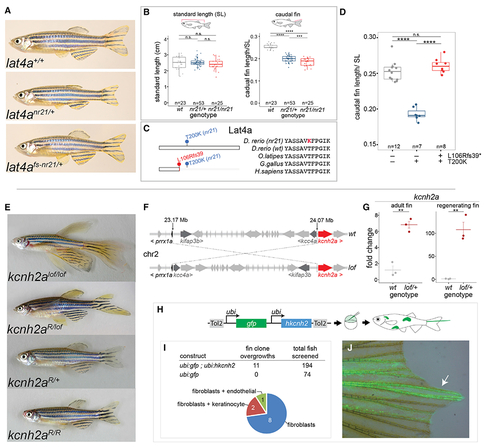
(A) Images of wild type, nr21 short fin mutant, and nr21 in cis frameshift revertant (L106Rfs39, nr21) zebrafish. (B) Comparison of fish standard length (SL) and caudal fin length in wild type, heterozygous (nr21/+), and homozygous (nr21/nr21) individuals. p values generated through Tukey’s HSD. ****adjusted p ≤ 0.0001 and ***adjusted p ≤ 0.001. n.s. indicates not significant. (C) Multiple sequence alignment of Lat4a showing the predicted T200K substitution of nr21 and location of frameshift reversion allele. (D) Caudal fin length normalized to fish SL in wild type, nr21, and revertant mutants. Schematic indicates location of mutations on Lat4a. ****Tukey’s HSD adjusted p ≤ 0.0001. (E) Revertant mutants of the zebrafish longfindt2 (lof) mutant obtained from a mutagenesis screen. Reversion alleles mapped to loss-of-function mutations in the voltage-gated potassium channel kcnh2a are shown. (F) Identified chromosomal inversion in lof. Note this inversion juxtaposes the regulatory region of prrx1a upstream of the kcnh2a transcription start site. For detailed positional mapping information, see Figure S3. (G) qRT-PCR showing upregulation of kcnh2a in adult and regenerating caudal fins of lof compared to wild type. Midline represents mean; errors bars represent ±1 SEM. (H) Mosaic overexpression assay to assess effect of hKCNH2 overexpression on fin growth. The plasmid is injected into single-cell zebrafish embryos with Tol2 transposase mRNA and is incorporated randomly into the genome, resulting in a mosaic patchwork of gene overexpression in the adult. (I) Number of overgrowths observed in injected zebrafish and marked cells underlying the overgrowth. (J) Example fin overgrowth showing GFP+ fibroblast clones within the overgrown fin rays (arrow). See also Figures S2 and S3. |
| Gene: | |
|---|---|
| Fish: | |
| Anatomical Terms: | |
| Stage: | Adult |
| Fish: | |
|---|---|
| Observed In: | |
| Stage: | Adult |