FIGURE SUMMARY
Title

Claudin-5 Affects Endothelial Autophagy in Response to Early Hypoxia

Authors
Yu, P., Li, Y., Zhong, G., Li, W., Chen, B., Zhang, J.
Source
Full text @ Front. Physiol.

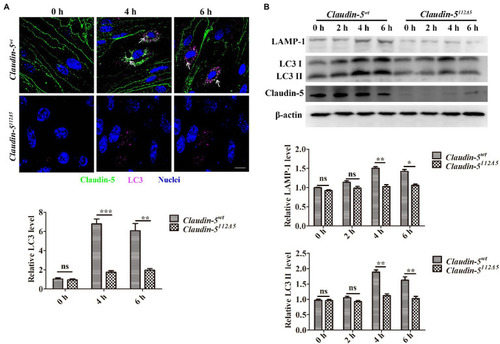
The specificity of the involvement of Claudin-5 in autophagy under hypoxia induction. (A) Confocal microscopy images of Claudin-5 (green) and LC3 (purple). Colocalization of Claudin-5 with LC3 (white arrow) and quantitative analysis of LC3 levels by Image-Pro Plus. Mean±SD, n=3 independent experiments per group. Scale bar, 10μm. (B) Western blot analysis of the autophagy markers LC3 and LAMP-1. Mean±SD, n=3 independent experiments per group. *p<0.05 **p<0.01 and ***p<0.005.

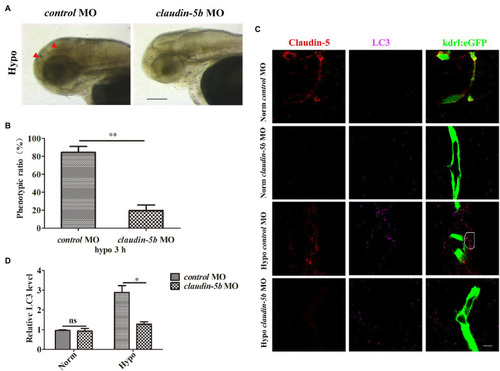
Loss of Claudin-5b in zebrafish embryos inhibits activation of autophagy in cerebrovascular endothelial cells (ECs). Morpholino (MO) silencing of claudin-5b in endothelial eGFP-specific transgenic Tg(kdrl:eGFP) zebrafish embryos. (A) Brain phenotype (red arrowheads) of control MO and claudin-5b MO zebrafish larvae in response to hypoxia. Scale bar, 100μm. (B) Quantitative analysis of the severe injury rates of control MO and claudin-5b MO zebrafish larval brains. Mean±SD, n=3 independent experiments per group. (C) Confocal microscopy images of Claudin-5 (red) and LC3 (purple). Scale bar, 5μm. (D) Quantitative analysis of LC3 levels by Image-Pro Plus. Mean±SD, n=3 independent experiments per group. *p<0.05 and **p<0.01.

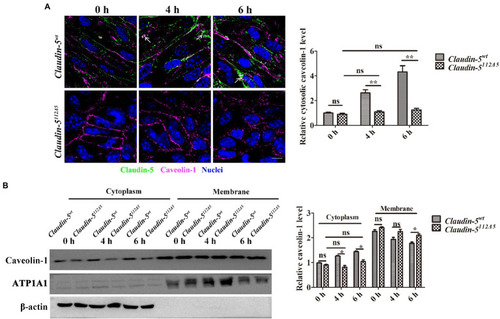
Caveolin-1 (Cav-1)-mediated Claudin-5 redistribution in response to hypoxia. (A) Confocal microscopy images of Claudin-5 (green) and Cav-1 (purple). Colocalization of Claudin-5 and Cav-1 (white arrows). Mean±SD, n=3 independent experiments per group. Scale bar, 10μm. (B) Western blot analysis of Cav-1 in the cytoplasm and membrane. Mean±SD, n=3 independent experiments per group. *p<0.05 and **p<0.01.

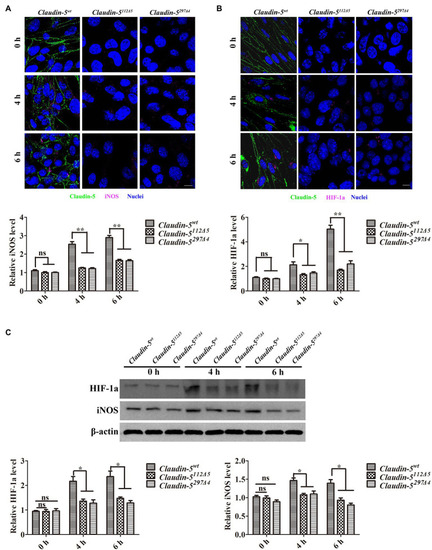
Inducible nitric oxide synthase (iNOS) induces Cav-1-mediated Claudin-5 translocation in response to hypoxia. (A,B) Confocal microscopy images of Claudin-5 (green), iNOS (purple), and hypoxia inducible factor 1 subunit alpha (HIF-1a; purple). Scale bar, 10μm. Mean±SD, n=3 independent experiments per group. (C) Western blot analysis of iNOS and HIF-1a. Mean±SD, n=3 independent experiments per group. *p<0.05 and **p<0.01.

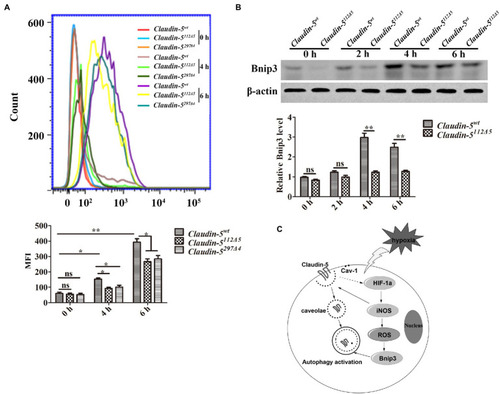
FIGURE 5. Reactive oxygen species (ROS) production drives BCL2/adenovirus E1B 19kDa protein interacting protein 3 (Bnip3) expression in brain microvascular endothelial (bEnd.3) cells in response to hypoxia. (A) ROS analysis by flow cytometry and quantitative analysis of ROS intensity. (B) Western blot analysis of Bnip3. MeanĀ±SD, n=3 independent experiments per group. *p<0.05 and **p<0.01. (C) Schematic illustrating the mechanism that Claudin-5 is involved in autophagy in cerebral vascular endothelial cells in the early stage of hypoxia.

Acknowledgments
This image is the copyrighted work of the attributed author or publisher, and ZFIN has permission only to display this image to its users. Additional permissions should be obtained from the applicable author or publisher of the image. Full text @ Front. Physiol.