
Image
|
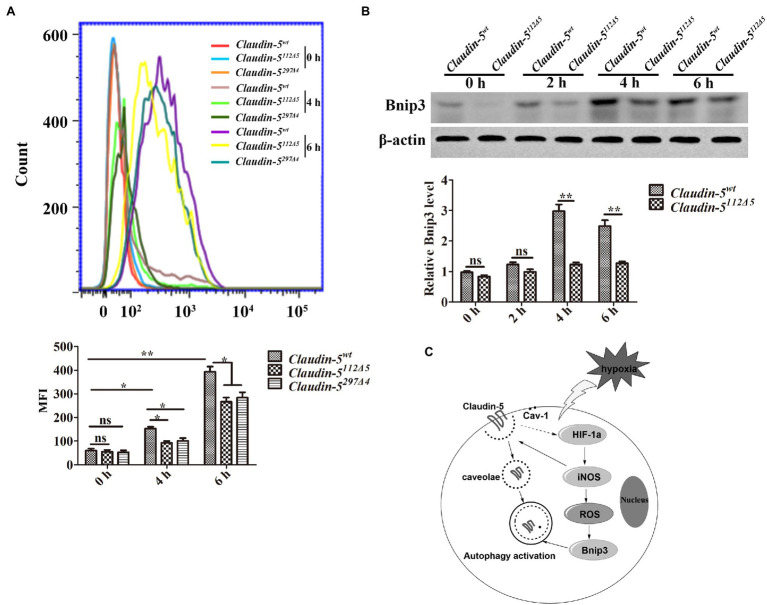
Figure Caption
Figure 5 FIGURE 5. Reactive oxygen species (ROS) production drives BCL2/adenovirus E1B 19kDa protein interacting protein 3 (Bnip3) expression in brain microvascular endothelial (bEnd.3) cells in response to hypoxia. (A) ROS analysis by flow cytometry and quantitative analysis of ROS intensity. (B) Western blot analysis of Bnip3. Mean±SD, n=3 independent experiments per group. *p<0.05 and **p<0.01. (C) Schematic illustrating the mechanism that Claudin-5 is involved in autophagy in cerebral vascular endothelial cells in the early stage of hypoxia.
Acknowledgments
This image is the copyrighted work of the attributed author or publisher, and
ZFIN has permission only to display this image to its users.
Additional permissions should be obtained from the applicable author or publisher of the image.
Full text @ Front. Physiol.