
- Title
-
Follistatin-controlled activin-HNF4α-coagulation factor axis in liver progenitor cells determines outcome of acute liver failure
- Authors
- Lin, T., Wang, S., Munker, S., Jung, K., Macías-Rodríguez, R.U., Ruiz-Margáin, A., Schierwagen, R., Liu, H., Shao, C., Fan, C., Feng, R., Yuan, X., Wang, S., Wandrer, F., Meyer, C., Wimmer, R., Liebe, R., Kroll, J., Zhang, L., Schiergens, T., Ten Dijke, P., Teufel, A., Marx, A., Mertens, P.R., Wang, H., Pa Ebert, M., Bantel, H., De Toni, E., Trebicka, J., Dooley, S., Shin, D., Ding, H., Weng, H.L.
- Source
- Full text @ Hepatology
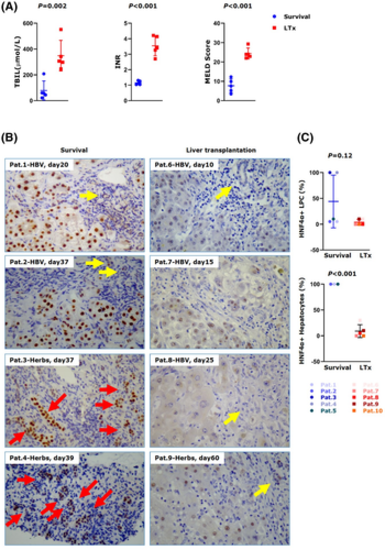
Recovered patients with massive hepatocyte loss–induced liver failure (MHL-LF) robustly express hepatocyte nuclear factor 4α (HNF4α) in either liver progenitor cells (LPCs) or hepatocytes. (A) Serum total bilirubin (TBIL), international normalized ratio (INR), and the Model for End-stage Liver Disease (MELD) scores are compared between 5 survivors and 5 patients with irreversible MHL-LF receiving liver transplantation (LTx). (B) Immunohistochemical staining for HNF4α was performed in these patients. Yellow and red arrows depict negative or positive HNF4α expression in LPCs. (C) Positive HNF4α hepatocytes and LPCs were counted in the collected patients, as described in Materials and Methods
|
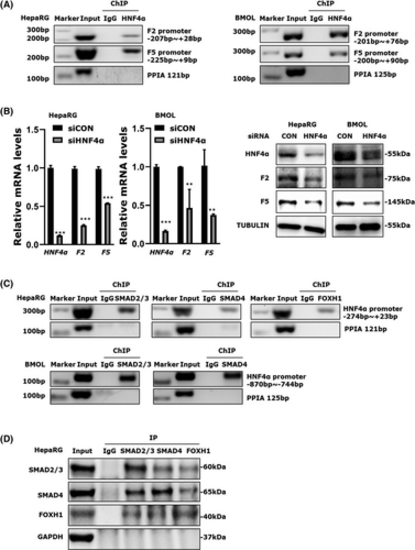
Sma and Mad homologs (SMADs)–forkhead box protein H1 (FOXH1) complex–controlled HNF4α regulates expression of coagulation factors in LPCs. (A) Chromatin immunoprecipitation (ChIP) assay was performed to measure HNF4α binding to the promoter of coagulation factor 2 (F2) and 5 (F5) genes in HepaRG and bipotential murine oval liver (BMOL) cells. (B) Quantitative PCR and western blotting were used to measure mRNA expression of coagulation factors in HepaRG and BMOL cells with or without HNF4α RNA interference (RNAi). (C) ChIP assay was performed to measure SMAD2/3, SMAD4, and FOXH1 binding to the promoter of hnf4α genes in HepaRG and BMOL cells. (D) Co-immunoprecipitation (Co-IP) was performed to measure SMADs binding to FOXH1 in HepaRG cells. The expression of the cyclophilin A (PPIA, peptidylprolyl isomerase A) was used as loading control in ChIP assay. Tubulin was used as loading control in western blotting. *p < 0.05, **p < 0.01, and ***p < 0.001
|
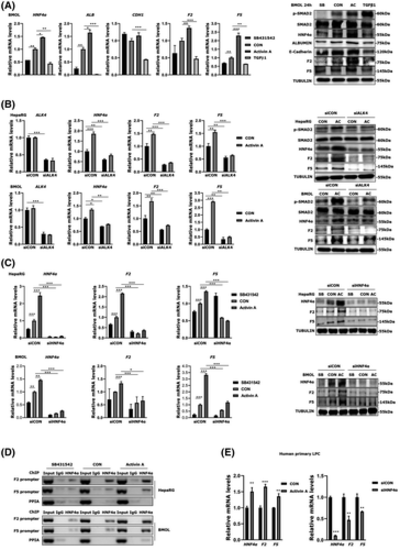
Activin, but not TGF-β, controls coagulation factors through HNF4α in LPCs. (A) Quantitative PCR and western blotting were used to measure the effects of activin (AC), TGF-β, and SB431542 (SB) administration for 24 h on mRNA and protein expression of cadherin-1 (cdh1)/E-cadherin, HNF4α, albumin (ALB), and F5 in BMOL cells. (B) Quantitative PCR and western blotting were performed to measure the impact of activin receptor like kinase 4 (ALK4) knockdown on mRNA and protein expression of cdh1/E-cadherin, HNF4α, albumin, and F5 in activin-treated HepaRG and BMOL cells. (C) Quantitative PCR and western blot measure mRNA and protein expression of HNF4α, F2, and F5 in HepaRG and BMOL cells with or without HNF4α knockdown by RNAi. (D) ChIP assay was performed to examine the effect of activin A (activin) and SB431542 on the binding of HNF4α to F2 and F5 gene promoters in HepaRG and BMOL cells. (E) Quantitative PCR measures the effects of activin on mRNA expression of HNF4α, F2, and F5 in primary human LPCs, and mRNA expression of F2 and F5 in primary human LPCs with or without RNAi-mediated depletion of HNF4α. Expression of PPIA was used as loading control in ChIP assay. Tubulin was used as a loading control in western blotting. *p < 0.05, **p < 0.01, and ***p < 0.001. AC, activin A; CON, control; SB, SB431542
|
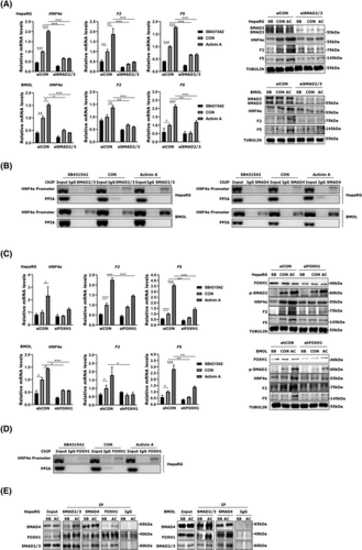
Activin controls coagulation factor expression in LPCs through the SMADs-FOXH1 complex-controlled HNF4α. (A) Quantitative PCR and western blot measure mRNA and protein expression of HNF4α, F2, and F5 in HepaRG and BMOL cells with or without SMAD2/3 knockdown by RNAi. (B) ChIP assay was performed to examine the role of activin and SB431642 on the binding of SMAD2/3 and SMAD4 to the HNF4A gene promoters in indicated LPCs. (C) Quantitative PCR and western blot measure mRNA and protein expression of HNF4α, F2, and F5 in HepaRG and BMOL cells with or without FOXH1 knockdown by RNAi. (D) ChIP assay examined the role of activin and SB431642 in the binding of FOXH1 to the HNF4A gene promoters in HepaRG cells. (E) Co-IP was performed to measure SMADs-FOXH1 complex formation in HepaRG and BMOL cells. The expression of PPIA was used as loading control in ChIP assay. Tubulin was used as loading control in western blotting. *p < 0.05, **p < 0.01, and ***p < 0.001
|
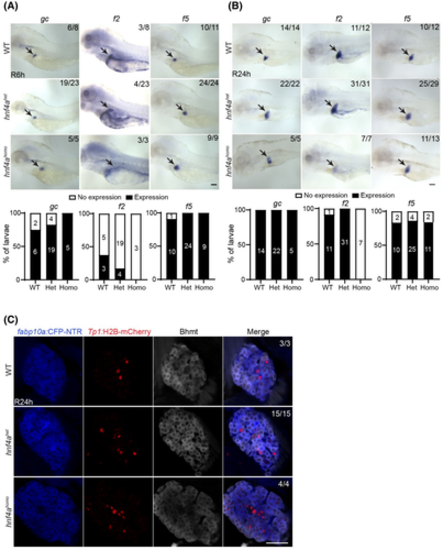
Zebrafish hnf4a mutants exhibit the reduced expression of coagulation factor 2, but normal cholangiocyte-to-hepatocyte conversion. (A,B) Whole-mount in situ hybridization images show the expression of gc, f2, and f5 in regenerating livers (arrows) at R6h (A) and R24h (B). Graphs show the percentage of larvae that express gc (albumin counterpart in zebrafish), f2, or f5 in the regenerating liver. (C) Single-optical section images show the expression of fabp10a:CFP-NTR (blue), Tp1:H2B-mCherry (red), and betaine-homocysteine S-methyltransferase (Bhmt; gray) in regenerating livers at R24h. Numbers in the upper-right corner indicate the proportion of larvae exhibiting the expression/phenotype pattern shown. Scale bars: 100 μm (A,B) and 50 (C) μm. CFP, cyan fluorescent protein; NTR, nitroreductase; R, regenerating; WT, wild type
|
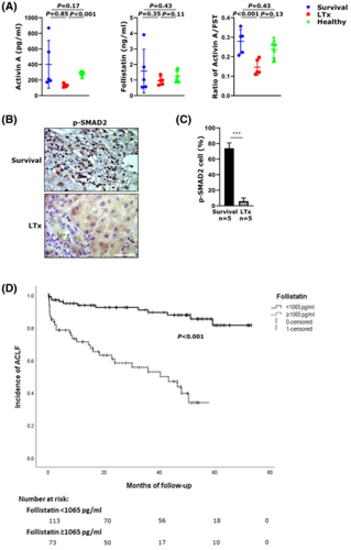
Follistatin (FST) negatively controls activin signaling and predicts the incidence of acute-on-chronic liver failure (ACLF). (A) Concentrations of activin and FST were measured by ELISA in 10 patients with MHL-LF and 13 healthy volunteers. The ratio of activin and FST was calculated. (B) Immunohistochemistry for p-SMAD2 is shown in 2 representative patients with MHL-LF. (C) Positive number of phosphorylated SMAD2 (p-SMAD2) in 10 patients with MHL-LF was counted. (D) Kaplan-Meier curves analysis was performed to calculate the incidence of ACLF in 186 patients with cirrhosis, as described in the Materials and Methods
|
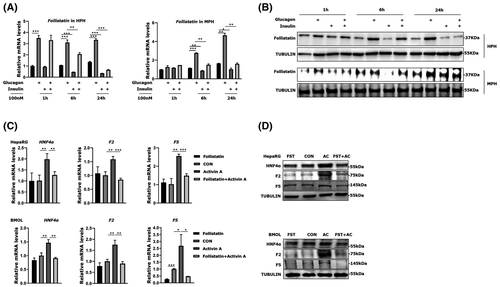
Insulin-regulated and glucagon-regulated FST determines the activin-HNF4α-coagulation factor axis in LPCs. (A,B) Quantitative PCR and western blot were used to measure mRNA and protein expression of FST in human primary hepatocytes (HPHs) and mouse primary hepatocytes (MPHs) with insulin and/or glucagon treatment. (C,D) Quantitative PCR and western blot were used to measure mRNA and protein expression of HNF4α and F5 in HepaRG and BMOL cells with activin and/or FSTs treatment for 24 h. Tubulin was used as loading control in western blotting. *p < 0.05, **p < 0.01, and ***p < 0.001
|
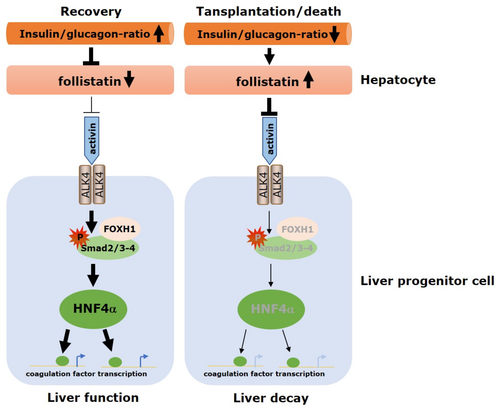
Hormone-controlled activin-HNF4α-coagulation factor axis in LPCs |