
IMAGE
Fig. 5
- ID
- ZDB-IMAGE-230205-15
- Genes
- Publication
- Lin et al., 2021 - Follistatin-controlled activin-HNF4α-coagulation factor axis in liver progenitor cells determines outcome of acute liver failure
- All Figures
- Figures for Lin et al., 2021
Image
|
Figure Caption
Fig. 5
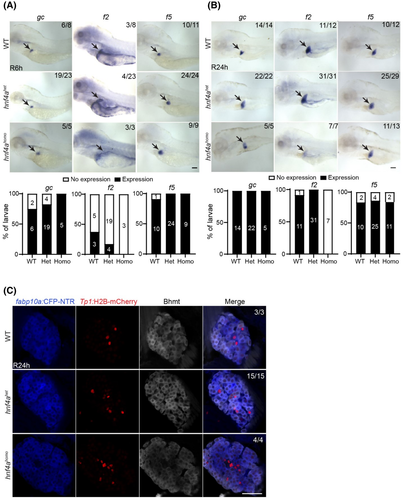
Zebrafish hnf4a mutants exhibit the reduced expression of coagulation factor 2, but normal cholangiocyte-to-hepatocyte conversion. (A,B) Whole-mount in situ hybridization images show the expression of gc, f2, and f5 in regenerating livers (arrows) at R6h (A) and R24h (B). Graphs show the percentage of larvae that express gc (albumin counterpart in zebrafish), f2, or f5 in the regenerating liver. (C) Single-optical section images show the expression of fabp10a:CFP-NTR (blue), Tp1:H2B-mCherry (red), and betaine-homocysteine S-methyltransferase (Bhmt; gray) in regenerating livers at R24h. Numbers in the upper-right corner indicate the proportion of larvae exhibiting the expression/phenotype pattern shown. Scale bars: 100 μm (A,B) and 50 (C) μm. CFP, cyan fluorescent protein; NTR, nitroreductase; R, regenerating; WT, wild type
Figure Data
Acknowledgments
This image is the copyrighted work of the attributed author or publisher, and
ZFIN has permission only to display this image to its users.
Additional permissions should be obtained from the applicable author or publisher of the image.
Full text @ Hepatology