
- Title
-
Conserved role of the urotensin II receptor 4 signalling pathway to control body straightness in a tetrapod
- Authors
- Alejevski, F., Leemans, M., Gaillard, A.L., Leistenschneider, D., de Flori, C., Bougerol, M., Le Mével, S., Herrel, A., Fini, J.B., Pézeron, G., Tostivint, H.
- Source
- Full text @ Open Biol.

Primary structure of frog Urp2 precursors. ( |

Phylogenetic tree of vertebrate UII-Urp precursor sequences. Phylogenetic analysis of 47 vertebrate prepro UII-Urp amino acid sequences was performed using the NJ distance-based method, with 1000 bootstrap replicates. The number shown at each branch node indicates in percentage the bootstrap value. Sequence references and alignment are given in the electronic supplementary material, figures S1 and S10, respectively. |

Figure 3. Synteny of genes in the urp2 locus in five selected osteichthyan species: human (H. sapiens), chicken (G. gallus), western clawed frog (X. tropicalis), spotted gar (L. oculatus) and zebrafish (D. rerio). Genes are represented by block arrows. The position of the genes (in megabases, Mb) is displayed below each box, according to the Ensembl database. The detailed chromosomal locations of genes displayed in this map are included in the electronic supplementary material, table S3. |
|
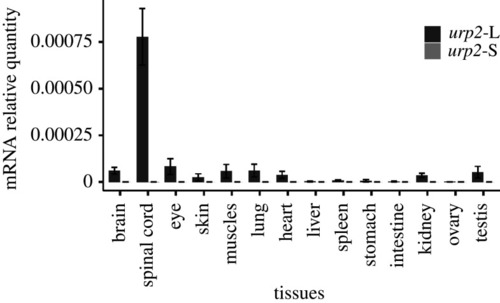
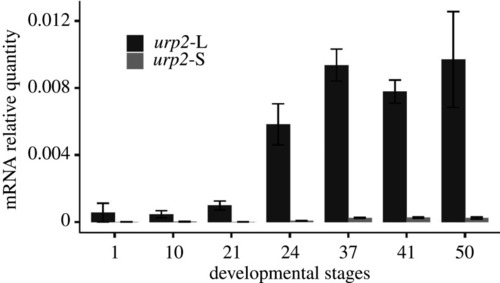
The tissue expression of |

Localization of |
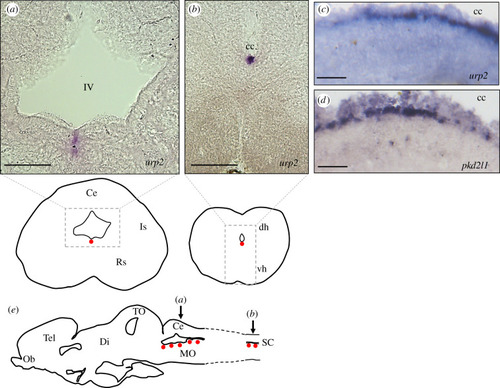
Localization of |
|

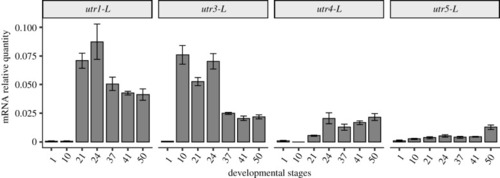
Localization of urotensin II receptor ( |
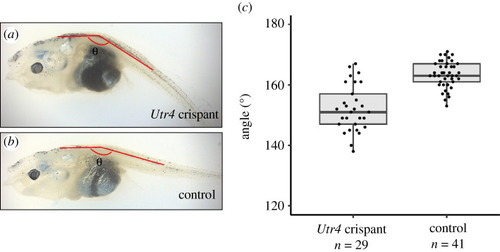
The phenotypic effect of |

Figure illustrating the tracking of a sequence of an |