
- Title
-
Neurons in the Dorso-Central Division of Zebrafish Pallium Respond to Change in Visual Numerosity
- Authors
- Messina, A., Potrich, D., Schiona, I., Sovrano, V.A., Fraser, S.E., Brennan, C.H., Vallortigara, G.
- Source
- Full text @ Cereb. Cortex
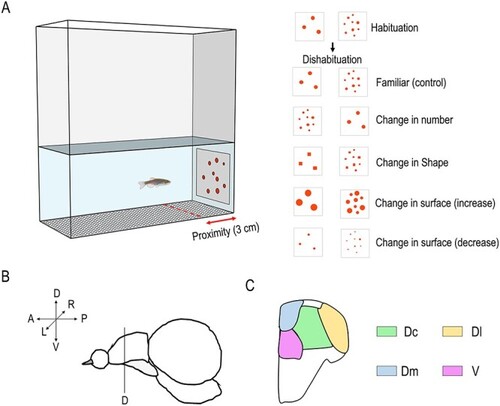
Experimental design. (A) Apparatus and stimuli used for the habituation and dishabituation phases. Scheme of the lateral view (B) of zebrafish telencephalon with a cross-section of telencephalic nuclei (C) tested for molecular biology analyses. Dc, dorsal-central; Dl, dorsal-lateral; Dm, dorsal-medial; V, subpallium. |
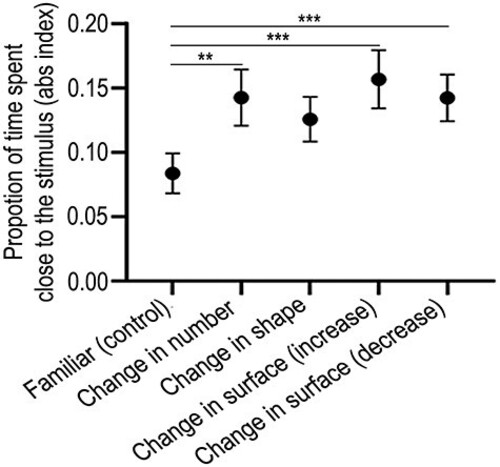
Behavioral data. Results of the dishabituation test expressed as the absolute proportion of time spent near the stimulus. Group means with standard error of mean (SEM) are shown. (**P < 0.01; ***P < 0.005; see text for details of statistics). |

IEG quantification. qPCR results for the relative expression of c-fos and egr-1 in the central part of area dorsalis telencephali (Dc), in the lateral part of area dorsalis telencephali (Dl), in the medial part of area dorsalis telencephali (Dm), and in the “ventral subpallium” (V) for the different test conditions. Group means with SEM are shown. (*P < 0.05; **P < 0.005; ***P < 0.000; see text for details of statistics). |
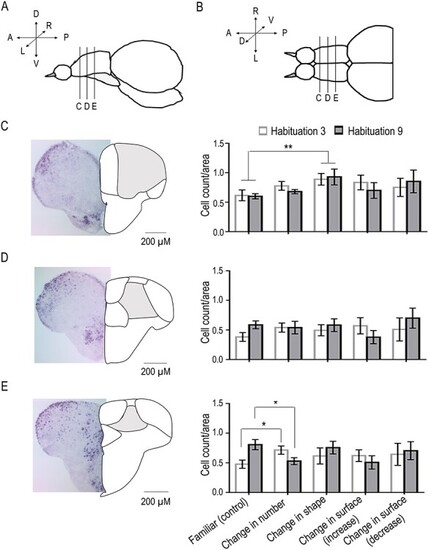
In situ hybridization analysis of egr-1. Mean number of egr-1-positive cells in three different rostro-caudal regions of Dc. Scheme of lateral (A) and dorsal (B) views of zebrafish telencephalon with results for the selected rostral (C), medial (D), and caudal (E) slices in the different test conditions. (Group means with SEM are shown. *P < 0.05; **P < 0.005; see text for details of statistics). |