
Image
|
Figure Caption
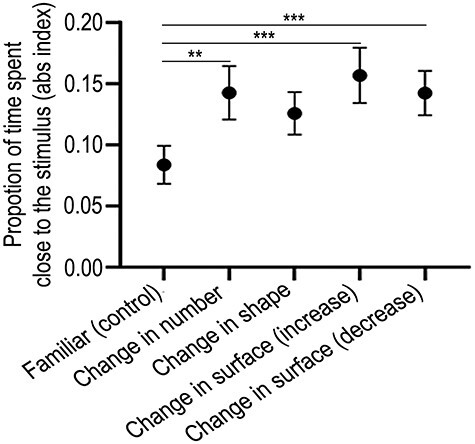
Fig. 2
Behavioral data. Results of the dishabituation test expressed as the absolute proportion of time spent near the stimulus. Group means with standard error of mean (SEM) are shown. (**P < 0.01; ***P < 0.005; see text for details of statistics).
Acknowledgments
This image is the copyrighted work of the attributed author or publisher, and
ZFIN has permission only to display this image to its users.
Additional permissions should be obtained from the applicable author or publisher of the image.
Full text @ Cereb. Cortex