
Image
|
Figure Caption
Fig. 3
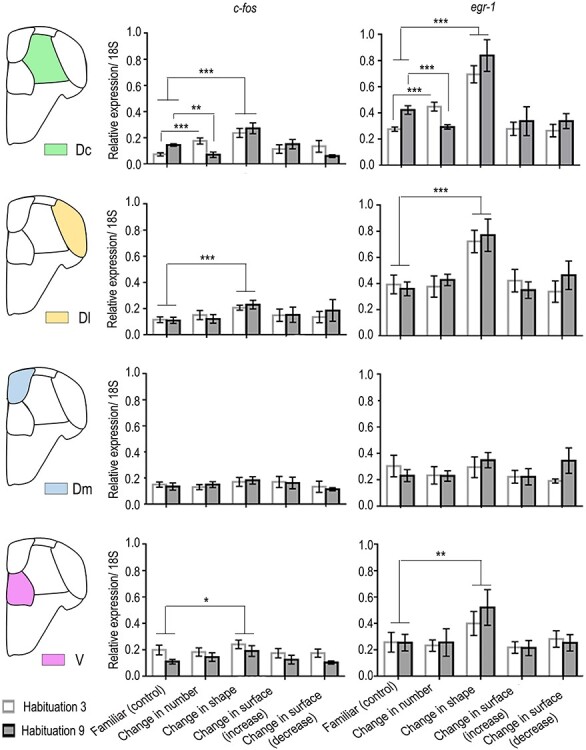
IEG quantification. qPCR results for the relative expression of c-fos and egr-1 in the central part of area dorsalis telencephali (Dc), in the lateral part of area dorsalis telencephali (Dl), in the medial part of area dorsalis telencephali (Dm), and in the “ventral subpallium” (V) for the different test conditions. Group means with SEM are shown. (*P < 0.05; **P < 0.005; ***P < 0.000; see text for details of statistics).
Acknowledgments
This image is the copyrighted work of the attributed author or publisher, and
ZFIN has permission only to display this image to its users.
Additional permissions should be obtained from the applicable author or publisher of the image.
Full text @ Cereb. Cortex