
- Title
-
The toxicity mechanism of toxic compounds from Euphorbiae pekinensis Radix on zebrafish embryos
- Authors
- Qin, W.N., Zhang, K.C., Geng, T., Cheng, F.F., Chen, P.D., Yao, W.F., Zhang, L., Cao, Y.D.
- Source
- Full text @ Biomed. Pharmacother.
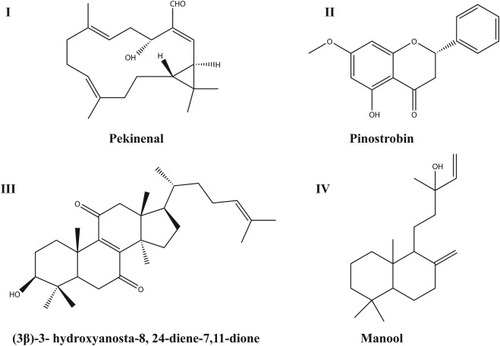
The chemical structures of compound I, II, III and IV. |
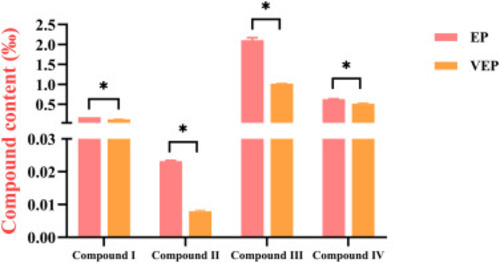
The content of compound I, II, III and IV in EP and VEP (n = 3) (* p < 0.05). |
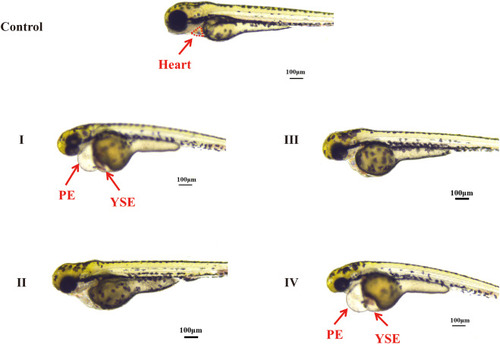
Effects of the toxic compounds on heart and yolk sac morphology of zebrafish embryos. Abnormal embryos were exposed to four compounds, and 0.4% DMSO was used for the control group. Four compounds were dissolved in the 0.4% DMSO (28.15 μM of I; 51.85 μM of II; 26.43 μM of III; 5.52 μM of IV). Each treatment group showed varying degrees of pericardial edema (PE) and yolk sac edema (YSE). |
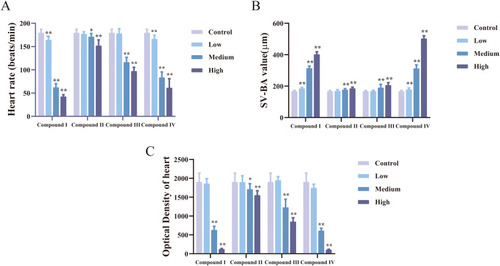
The effect of four compounds on the heart of zebrafish embryos. (A) The heart rate of zebrafish embryos. (B) The SV-BA value of zebrafish embryos. (C) The optical density of heart of zebrafish embryos after treatment. Values were expressed as mean ± SD of three independent experiments. * p < 0.05, ** p < 0.01 versus control group. |
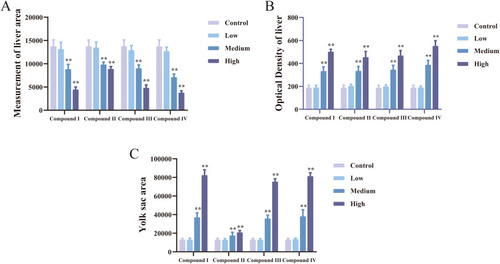
The effect of four compounds on the liver and yolk sac of zebrafish embryos. (A) The liver area value of zebrafish embryos. (B) The optical density value of liver of zebrafish embryos. (C) The yolk sac area of zebrafish embryos after treatment. Values were expressed as mean ± SD of three independent experiments. * p < 0.05, ** p < 0.01 versus control group. |
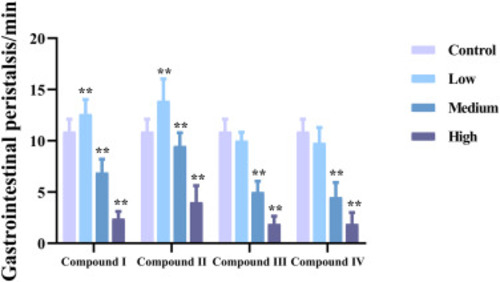
The number of gastrointestinal peristalsis of zebrafish in each group. Values were expressed as mean ± SD experiments. * p < 0.05, ** p < 0.01 versus control group. |

The analysis of oxidative damage of zebrafish embryos. (A) The contents of MDA of zebrafish embryos. (B) The GSH-PX value of zebrafish embryos after treatment. (C) The SOD value of zebrafish embryos in each group. Values were expressed as mean ± SD of three independent experiments. * p < 0.05, ** p < 0.01 versus control group. |
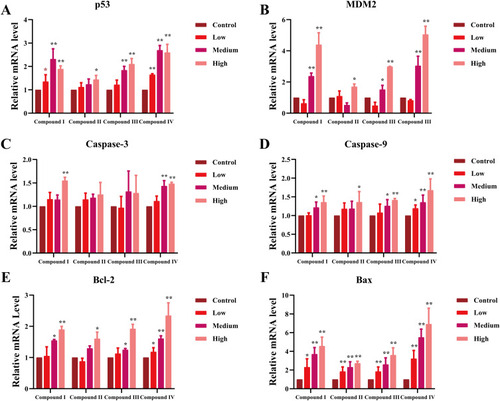
The effect of toxic compounds on the expression of apoptosis-related genes in zebrafish embryos. (A) The contents of p53 in zebrafish embryo. (B) The activity of MDM2 in zebrafish embryo. (C) The contents of caspase-3 in zebrafish embryo. (D) The contents of caspase-9 in zebrafish embryo. (E) The contents of Bcl-2 in zebrafish embryo. (F) The contents of Bax in zebrafish embryo. Values were expressed as mean ± SD of three independent experiments. * p < 0.05, ** p < 0.01 versus control group. |