
Image
|
Figure Caption
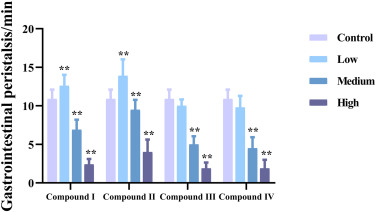
Fig. 6 The number of gastrointestinal peristalsis of zebrafish in each group. Values were expressed as mean ± SD experiments. * p < 0.05, ** p < 0.01 versus control group.
Acknowledgments
This image is the copyrighted work of the attributed author or publisher, and
ZFIN has permission only to display this image to its users.
Additional permissions should be obtained from the applicable author or publisher of the image.
Full text @ Biomed. Pharmacother.