
Image
|
Figure Caption
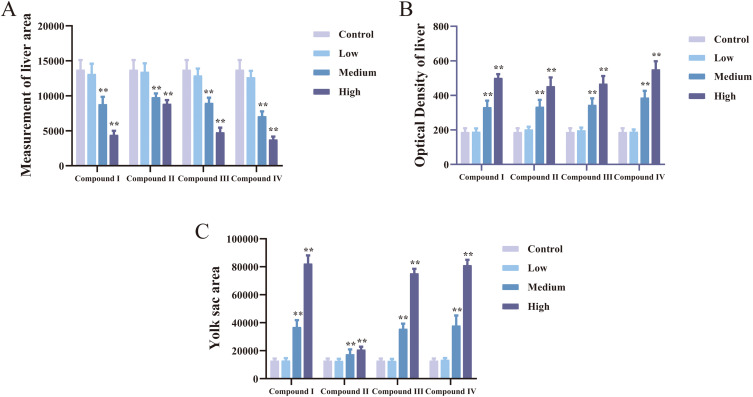
Fig. 5 The effect of four compounds on the liver and yolk sac of zebrafish embryos. (A) The liver area value of zebrafish embryos. (B) The optical density value of liver of zebrafish embryos. (C) The yolk sac area of zebrafish embryos after treatment. Values were expressed as mean ± SD of three independent experiments. * p < 0.05, ** p < 0.01 versus control group.
Acknowledgments
This image is the copyrighted work of the attributed author or publisher, and
ZFIN has permission only to display this image to its users.
Additional permissions should be obtained from the applicable author or publisher of the image.
Full text @ Biomed. Pharmacother.