
- Title
-
In Silico Target Prediction of Overexpressed microRNAs from LPS-Challenged Zebrafish (Danio rerio) Treated with the Novel Anti-Inflammatory Peptide TnP
- Authors
- Disner, G.R., Falcão, M.A.P., Lima, C., Lopes-Ferreira, M.
- Source
- Full text @ Int. J. Mol. Sci.
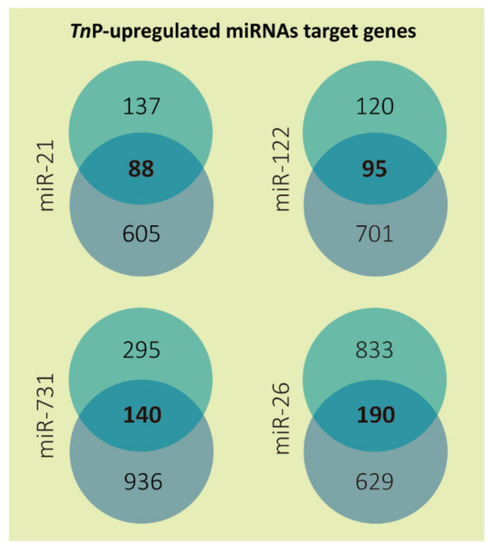
Number of predicted target genes for each TnP-induced microRNA. The targets predicted by DIANA microT-CDS (miTG score > 0.7) are presented in the top circles and by TargetScanFish (score + context < −0.2) in the bottom circles; in the center is shown the overlapped results representing only the genes mutually found. The miR-26 targets from DIANA microT-CDS are the sum of miR-26a and 26b predictions, excluding duplicates. |
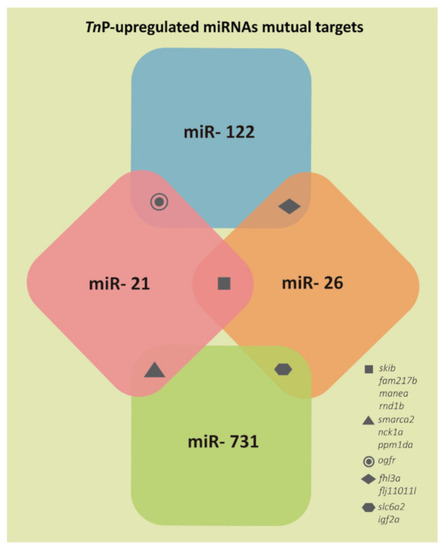
Representation of the few target genes mutually predicted for two of the TnP-induced miRNAs investigated. |

Gene Ontology enrichment analysis in the “Biological Process” category for the predicted target genes of TnP-induced miR-21, miR-122, miR-731, and miR-26. It illustrates the most enriched terms and some classes relevant for the experimental condition. The color scale, from darker to lighter, represents the terms with more genes in it (bottom) or with just a few genes (top), based on the enrichment analysis. |
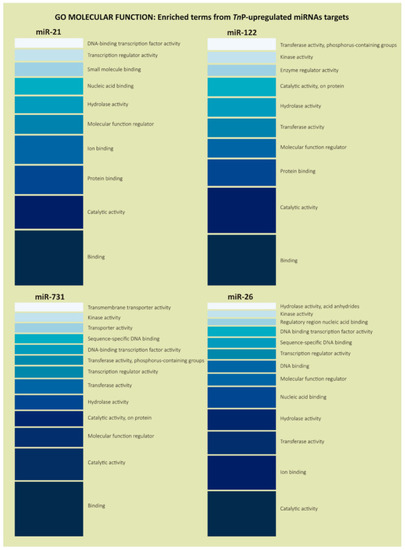
Gene Ontology enrichment analysis in the “Molecular Function” category for the predicted target genes of TnP-induced miR-21, miR-122, miR-731, and miR-26. It illustrates the most enriched terms and some classes relevant for the experimental condition. The color scale, from darker to lighter, represents the terms with more genes in it (bottom) or with just a few genes (top), based on the enrichment analysis. |
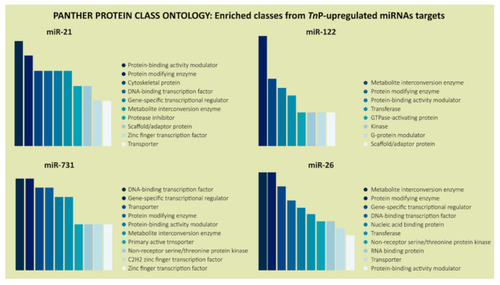
PANTHER classification system in the “Protein Class” category for the predicted target genes of TnP-induced miR-21, miR-122, miR-731, and miR-26. The color scale, from darker to lighter, represents the most common protein classes coded by the putative targets. |
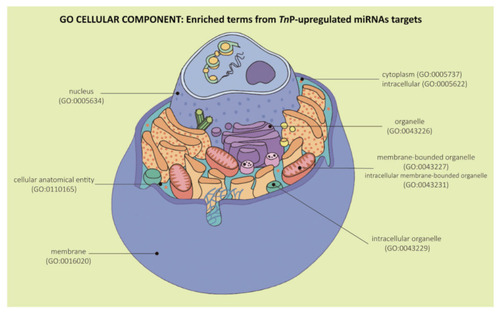
Representation of Gene Ontology enrichment analysis in the “Cellular Component” category for the predicted target genes of TnP-induced miR-21, miR-122, miR-731, and miR-26 altogether. Figure adapted from Cell Anatomy Viewer v. 2.1, Arizona State University. |