
Image
|
Figure Caption
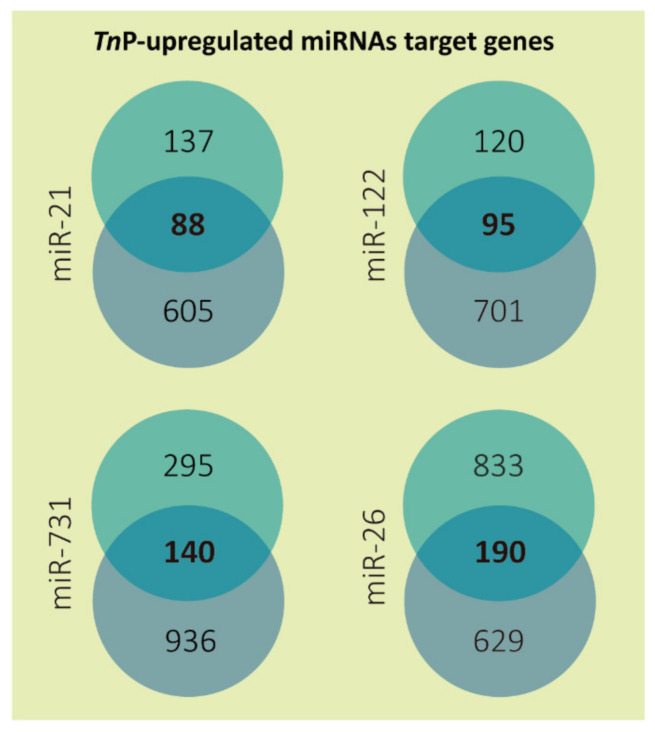
Figure 1 Number of predicted target genes for each TnP-induced microRNA. The targets predicted by DIANA microT-CDS (miTG score > 0.7) are presented in the top circles and by TargetScanFish (score + context < −0.2) in the bottom circles; in the center is shown the overlapped results representing only the genes mutually found. The miR-26 targets from DIANA microT-CDS are the sum of miR-26a and 26b predictions, excluding duplicates.
Acknowledgments
This image is the copyrighted work of the attributed author or publisher, and
ZFIN has permission only to display this image to its users.
Additional permissions should be obtained from the applicable author or publisher of the image.
Full text @ Int. J. Mol. Sci.