
Image
|
Figure Caption
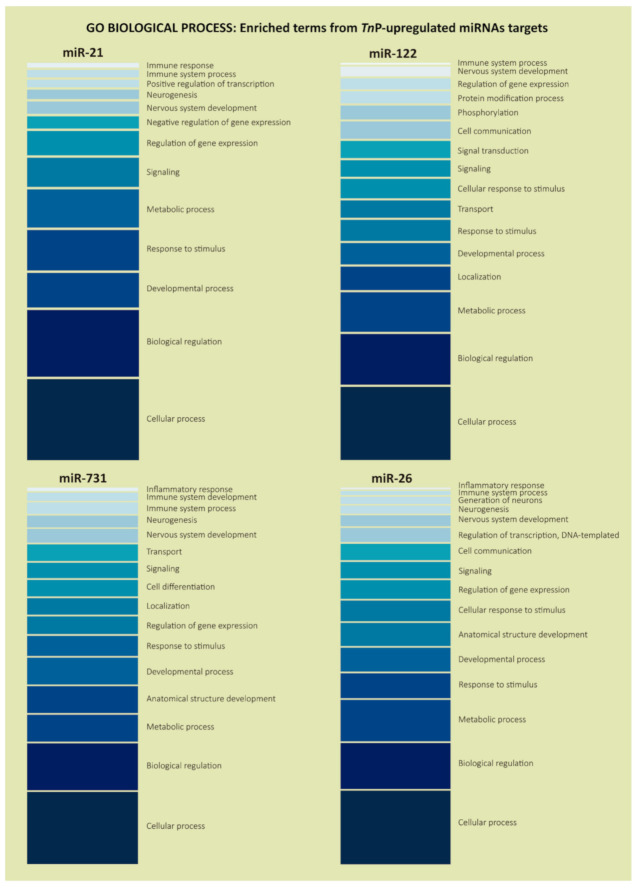
Figure 3 Gene Ontology enrichment analysis in the “Biological Process” category for the predicted target genes of TnP-induced miR-21, miR-122, miR-731, and miR-26. It illustrates the most enriched terms and some classes relevant for the experimental condition. The color scale, from darker to lighter, represents the terms with more genes in it (bottom) or with just a few genes (top), based on the enrichment analysis.
Acknowledgments
This image is the copyrighted work of the attributed author or publisher, and
ZFIN has permission only to display this image to its users.
Additional permissions should be obtained from the applicable author or publisher of the image.
Full text @ Int. J. Mol. Sci.