FIGURE SUMMARY
Title

The Antitumor Activity and Mechanism of a Natural Diterpenoid From Casearia graveolens

Authors
Li, Y., Ma, J., Song, Z., Zhao, Y., Zhang, H., Li, Y., Xu, J., Guo, Y.
Source
Full text @ Front Oncol

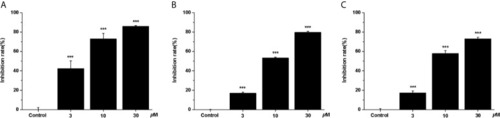
Anti-proliferative effects of casearlucin A treatment on three cell lines. HepG2 (A), A549 (B) and Hela (C) cells were treated with casearlucin A (3, 10, and 30 μM) for 48 h. Cell viability was examined using MTT assay. DMSO was used as a negative control. The results are presented as means ± SD. ***p < 0.001 versus control group.

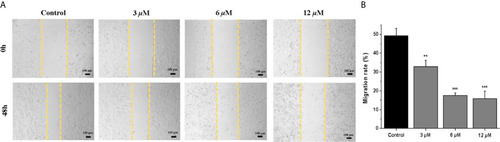
Casearlucin A inhibited HepG2 cells in wounded healing assay. (A) HepG2 cells were photographed at 0 h and 48 h (scale bar: 100 μm). Data of Migration rate (%) were shown in (B). DMSO was used as a negative control. The results are presented as means ± SD. **p < 0.01, and ***p < 0.001 versus control group.

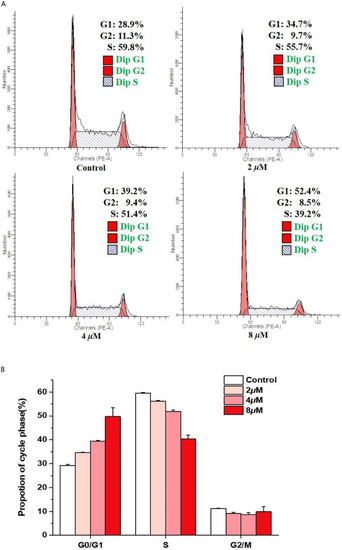
Arrest effects of casearlucin A on HepG2 cell cycle. HepG2 cells were treated with different concentrations (2, 4, and 8 μM) of casearlucin A for 48 h. DMSO was used as a negative control. (A) The cells were harvested and stained with propidium iodide (PI), and the cell cycle distribution was analyzed using flow cytometry. (B) Data processing of cell cycle distribution. Data from three separate experiments are expressed as means ± SD.

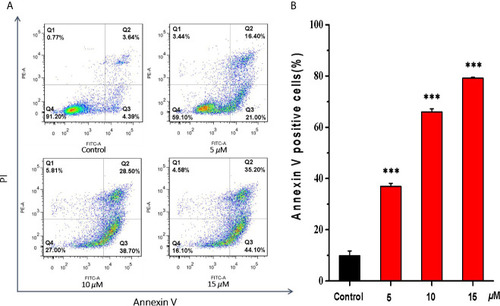
Apoptosis effects of HepG2 cells induced by casearlucin A. HepG2 cells were treated with different concentrations (5, 10, and 15 μM) of casearlucin A for 48 h. DMSO was used as a negative control. Then, the cells were harvested, stained with Annexin V and propidium iodide (PI), and subsequently analyzed by flow cytometry. (A) Flow cytometric analysis of HepG2 cells after treated with different concentrations of casearlucin A. (B) Histogram of apoptotic cells at 48 h with the treatment of casearlucin A. Data from three separate experiments are expressed as means ± SD. ***p < 0.001 versus control group.

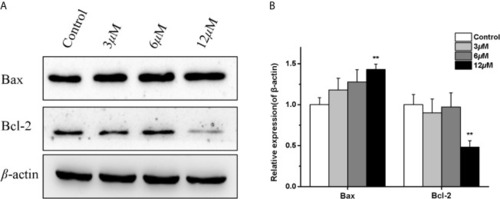
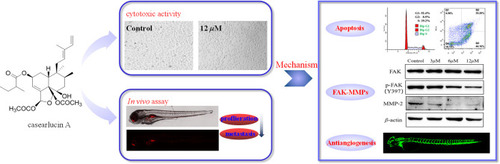
Effects of casearlucin A on apoptosis related proteins expression in HepG2 cells. HepG2 cells were pre-treated with casearlucin A for 36 h, and western blotting analysis was performed. DMSO was used as a negative control. (A) Western blotting results of protein levels. (B) Quantitative analysis of apoptosis related proteins expression. β-Actin protein was used as internal reference. **p < 0.01 compared with control group cells. Data were obtained by at least three independent experiments.

Effects of casearlucin A on metastasis-related proteins expression in HepG2 cells. HepG2 cells were pre-treated with casearlucin A for 36 h, and western blotting analysis was performed. DMSO was used as a negative control. (A) Western blotting results of protein levels. (B) Quantitative analysis of metastasis-related proteins expression. β-Actin protein was used as an internal reference. *p < 0.05, and **p < 0.01 compared with control group cells. Data were obtained by at least three independent experiments.

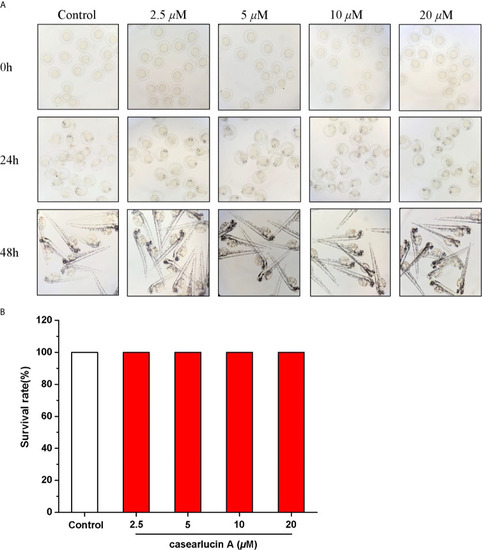
Developmental toxicity of casearlucin A in Zebrafish Embryos. The zebrafish embryos were treated with casearlucin A (2.5, 5, 10, and 20 μM) for 48 h. (A) The morphology of zebrafish. (B) The survival rate of zebrafish. DMSO was used as a negative control.

Anti-angiogenesis activity of casearlucin A in transgenic zebrafish model. The embryos from transgenic zebrafish Tg (fli1: EGFP) were treated by the tested compound and the anti-angiogenetic compound, sunitinib malate (positive control). DMSO was used as a negative control. After exposure to the compounds for 48 h, the development of intersegmental vessels (ISVs) and dorsal longitudinal anastomotic vessels (DLAVs) were observed, and the length of ISV vessels was measured using ImageJ program. (A) Representative images of zebrafish embryos treated with vehicle, casearlucin A, and sunitinib malate. (B) The average length of ISVs of zebrafish after treated with different concentrations of casearlucin A (5, 10, and 20 μM). (n = 15 for each experimental group). *p < 0.5, ***p < 0.001 versus control group.

In vivo anti-tumor effects of casearlucin A in zebrafish xenografts. CM-DiI stained HepG2 cells were transplanted into 2 dpf zebrafish embryos by microinjecting. 4 h later, tumor-bearing embryos were treated with casearlucin A (5, 10, and 20 μM) and etoposide (10 μM) for 48 h (n = 15/group). DMSO was used as a negative control. (A)Intensity and distribution of the red fluorescence were imaged under a confocal microscope. (B) Fluorescence intensity of the tumor xenografts, representing the number of HepG2 cells. (C) Quantification of the fluorescent area of the tumor xenografts, representing HepG2 cell metastasis. Results are expressed as means ± SD. **p < 0.01 and ***p < 0.001 versus control group.

Acknowledgments
This image is the copyrighted work of the attributed author or publisher, and ZFIN has permission only to display this image to its users. Additional permissions should be obtained from the applicable author or publisher of the image. Full text @ Front Oncol