
- Title
-
In vivo glucose imaging in multiple model organisms with an engineered single-wavelength sensor
- Authors
- Keller, J.P., Marvin, J.S., Lacin, H., Lemon, W.C., Shea, J., Kim, S., Lee, R.T., Koyama, M., Keller, P.J., Looger, L.L.
- Source
- Full text @ Cell Rep.
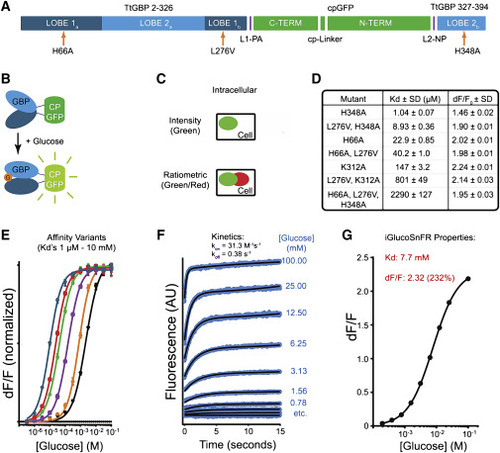
(A) Schematic of iGlucoSnFR sensor sequence. Circularly permuted green fluorescent protein (cpGFP, green) was inserted into glucose-binding protein (GBP, light and dark blue) from T. thermophilus. Affinity-lowering mutations are indicated (orange arrows). “LOBEs” refer to the two subdomains on opposing sides of the ligand-binding pocket of GBP. (B) Schematic of iGlucoSnFR sensor construction. cpGFP (green) was inserted into GBP (light and dark blue) from T. thermophilus such that binding of glucose (G, orange disk) to GBP induced fluorescence increases in cpGFP. (C) Sensor architecture. Sensors were made with the addition of a glucose-insensitive red fluorescent protein mRuby2 to allow for ratiometric measurements and/or cell typing. Sensors are shown schematically as green ellipses; mRuby2 is shown as red ellipses. (D and E) Affinity variants. Permutations of binding site residue mutations (H66A, L276V, K312A, H348A) yielded iGlucoSnFR variants with affinities spanning the range of 1 μM to 10 mM when measured in PBS. Each curve in (E) represents a sensor with different affinity, with fluorescence changes normalized by lowest and highest values. The last entry in (D) (H66A, L276V, H348A) and the rightmost curve in (E) represent iGlucoSnFR as used in the rest of the text. Values are mean ± SD of n = 3 experimental replicates. (F) iGlucoSnFR kinetics. Stopped-flow fluorescence measurements on the final construct were performed at several concentrations, and kinetic rate constants were fit to data. Values are mean ± SD of n = 5 experimental replicates. (G) Final iGlucoSnFR binding curve, constructed from the data in (F). Sensor parameters are as shown. Note that these data were collected at pH 8.2 to increase ΔF/F for kinetics accuracy, thus increasing the KD relative to neutral pH. Error bars (SD) are plotted, but they are hidden by the symbols. Values are mean ± SD of n = 3 experimental replicates. |
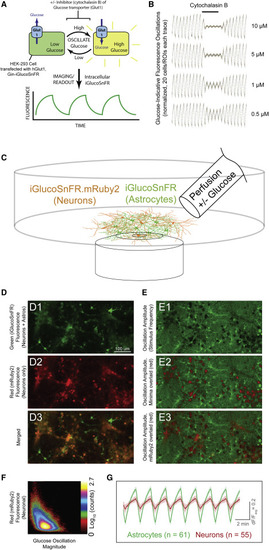
(A) Schematic of transporter assay. Cultured cells (HEK293) were co-transfected with plasmids for expression of iGlucoSnFR and the human glucose uniporter hGlut1. Buffers were oscillated with and without glucose, eliciting oscillating fluorescence responses, which were subsequently diminished by overlaying constant concentrations of the glucose transporter inhibitor cytochalasin B at various concentrations. (B) Oscillating fluorescence responses and inhibition. Twenty regions of interest (ROIs) corresponding to cells were identified by fast Fourier transform (FFT) magnitude in initial segments without inhibitor and were filtered over the whole experiment by subtraction of a moving-window average of length corresponding to the stimulus period. Each trace was then normalized by root-mean-square deviation (RMSD) during the pre-treatment phase and plotted as individual data points. In the middle segment (indicated at top), cytochalasin B was added at the concentrations indicated at the right of each trace. After removing cytochalasin B, oscillation magnitudes returned to initial values. Imaging parameters were: two channels: excitation (Ex) 488 nm, emission (Em) 505–550; Ex 561, Em 565–650; objective EC Plan-Neofluar 10×/0.3 numerical aperture (NA) M27, imaging rate ∼1 Hz; 512 × 512 pixels; stimulus period 60 s. (C) Schematic of neuronal culture assay. Acute astrocyte-neuron co-cultures from rat hippocampus were infected with AAVs driving iGlucoSnFR-mRuby2 expression in neurons (hSynapsin-1 promoter) and green-only iGlucoSnFR in astrocytes (gfaABC1D promoter). ACSF + 20 mM glucose or sorbitol was continuously perfused, and fluorescence changes were measured. (D and E)) Fluorescence imaging of co-cultures. (D1–D3) Fluorescence images for each channel are shown as indicated. (E1–E3) Images of pixelwise temporal FFT magnitudes at stimulus frequency, indicative of glucose concentration changes. E1 shows amplitudes in green. E2 shows the same image but with FFT minima overlaid in red, for comparison with the mRuby2 signals overlaid in E3 (also see alone in D2). Two channels: Ex 488 nm, Em 505–550; Ex 561, Em 565–650; objective Plan-Apochromat 20×/0.8 NA M27, imaging rate ∼1 Hz; 1,024 × 512 pixels; stimulus period 120 s. (F) Correlation plot between FFT magnitude (x axis) and mRuby2 signal (y axis). Note clear (albeit weak) anti-correlation between the two (correlation coefficient [CC] of ∼−0.5): high intensity in the red channel corresponds to weak magnitudes and vice versa. (G) Averaged fluorescence responses (ΔF/Favg) to oscillating stimulus from astrocytes (identified by high-thresholded green/red fluorescence ratio) and neurons (identified by high red fluorescence signals). ΔF/Favg was calculated by subtraction of a moving window average with size corresponding to the period of the stimulus oscillations followed by division by the same moving average. Note the larger magnitude of glucose response in astrocytes. Error bars represent SD in fluorescence responses within each group. Nearly identical results with reversed tags are shown in Figure S2. |
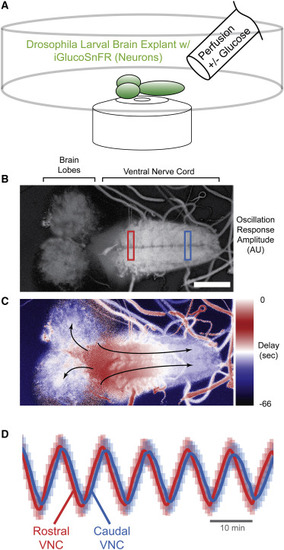
(A) Schematic of assay. Third-instar larval fly CNS expressing iGlucoSnFR-mRuby2 in all neurons (57C10 driver), embedded in a thin layer of 1% agar, were subjected to continuous perfusion with and without glucose under continuous volumetric confocal imaging. Eight planes at 4.8-μm steps; two channels: Ex 488 nm, Em 505–550; Ex 561, Em 565–650; objective Plan-Apochromat 20×/0.8 NA M27, imaging rate ∼9 s per volume; 1,024 × 512 pixels; stimulus period 10 min. Scale bar, 100 μm. (B) FFT amplitudes of response. Time-lapse intensity-normalized average projections in z were subjected to pixelwise temporal FFT. Magnitudes at stimulus frequency were extracted and are represented in grayscale. (C) FFT phases/delays of response. Similar to (B), but here stimulus frequency phases were extracted, revealing a temporal gradient in glucose response along the axis of the VNC neuropil and to a lesser extent in the brain lobes (arrows indicate direction of response). (D) ΔF/Favg traces from VNC. Normalized fluorescence traces from rectangular regions of interest at rostral or caudal ends of VNC as indicated. Note phase shift. Error bars represent SD of pixels within each ROI. |

(A) Glucose responses to spontaneous muscle twitches. We generated a zebrafish line that expresses iGlucoSnFR broadly (β-actin promoter) and the red calcium indicator jRGECO1a in muscle (α-actinin promoter). Non-anesthetized, non-paralyzed fish were imaged 5–6 days post-fertilization (dpf) for spontaneous responses to muscle twitches. Representative averaged traces from volumetric time-lapse confocal imaging of fed and never-fed fish are presented as indicated. Flin, fluorescence response divided by a linear baseline. (B) Imaging of insulin responses. 13 dpf zebrafish broadly expressing iGlucoSnFR (β-actin promoter) are shown. (B1) Schematic illustrating anatomy. Note injection pipette poised for injection into the posterior cardinal vein (PCV). (B2) Red fluorescence channel immediately post-injection with insulin and sulforhodamine-101 (SR101) as a marker dye. The entire vasculature became transiently fluorescent red after injection, demonstrating efficacy of systemic injection. (B3 and B4) iGlucoSnFR fluorescence before and after insulin injection. ROIs on brain (“B”) and muscle (“M”) as indicated are plotted in (C). Two channels: Ex 488 nm, Em 505–550; Ex 561, Em 565–650; objective EC Plan-Neofluar 10×/0.3 NA M27, imaging rate ∼1 s per image; 512 × 512 pixels. (C) Insulin-induced fluorescence changes. Red trace indicates injection of dye or dye plus insulin. Green trace indicates iGlucoSnFR fluorescence measured from muscle (ROI “M” in panel B). Blue trace indicates iGlucoSnFR fluorescence measured from brain (ROI “B” in panel B). Small, artifactual changes in fluorescence appear with introduction of the pipette (dye-only injection). Sustained fluorescence increases arise after insulin injection. (D) Imaging organism-scale responses of iGlucoSnFR to epinephrine addition. 5 dpf fish expressing both iGlucoSnFR (all cells, β-actin promoter) and jRGECO1a (muscle cells, α-actinin promoter). Top two images (before and after epinephrine, sagittal section) show false-color raw intensities from a volumetric time-lapse iGlucoSnFR movie average-projected in z. ROIs on muscle (“M”) and brain (“B”) are plotted in (E). Bottom image shows ΔF/F after addition of epinephrine, with muscle showing the greatest changes. 5 dpf; 15 planes at 15-μm steps; two channels: Ex 488 nm, Em 505–550; Ex 561, Em 565–650; objective EC Plan-Neofluar 10×/0.3 NA M27, imaging rate ∼10 s per volume; 512 × 256 pixels. (E) Epinephrine-induced fluorescence changes. Blue trace indicates iGlucoSnFR fluorescence measured from hindbrain (ROI “B” in panel D). Green trace indicates iGlucoSnFR fluorescence measured from muscle (ROI “M” in panel D). Red trace indicates jRGECO1a fluorescence measured from the same muscle ROI. F0 was defined as the averaged intensity value just before addition of epinephrine to the bath, as indicated. Note the delayed increase of neuronal activity subsequent to glucose increases. (F) Liver iGlucoSnFR responses to glucose and epinephrine. Ratio image (iGlucoSnFR/mRuby2) is shown of average of two confocal places (20 μm total) over eight time points (80 s) of a 7 dpf fish expressing mRuby-tagged iGlucoSnFR in liver (fabp10a promoter) before and after epinephrine addition. Plotted area in (G) is indicated by white box. 20 planes at 10-μm steps; two channels: Ex 488 nm, Em 505–550; Ex 561, Em 565–650; objective Plan-Apochromat 20×/0.8 NA M27, imaging rate ∼10 s per volume; 1,024 × 512 pixels. (G) Glucose and epinephrine-induced fluorescence ratio changes in liver. Glucose and epinephrine were added to bath at indicated times. ROIs adjacent in x, y, and z showed similar responses. (H) Imaging brain-scale epinephrine responses. Single coronal section confocal plane (after stack registration) is shown of a 5 dpf fish expressing both iGlucoSnFR (all cells, β-actin promoter) and jRGECO1a (neurons, elavl3 promoter) before and after epinephrine addition. ROIs on muscle (“M”) and cerebellum (“B”) are plotted in (I). 5 dpf; 40 planes at 3.3-μm steps; two channels: Ex 488 nm, Em 505–550; Ex 561, Em 565–650; objective Plan-Apochromat 20×/0.8 NA M27, imaging rate ∼25 s per volume; 512 × 256 pixels. (I) Epinephrine-induced fluorescence changes in the brain. Green trace indicates iGlucoSnFR fluorescence measured from muscle (ROI “M” in panel H). Blue trace indicates iGlucoSnFR fluorescence measured from cerebellum (ROI “B” in panel H). Red trace indicates jRGECO1a fluorescence from same cerebellum ROI. F0 was derived from the averaged intensity values just before addition of epinephrine to the bath. |