
Fig. 2
- ID
- ZDB-IMAGE-220113-18
- Publication
- Keller et al., 2021 - In vivo glucose imaging in multiple model organisms with an engineered single-wavelength sensor
- All Figures
- Figures for Keller et al., 2021
|
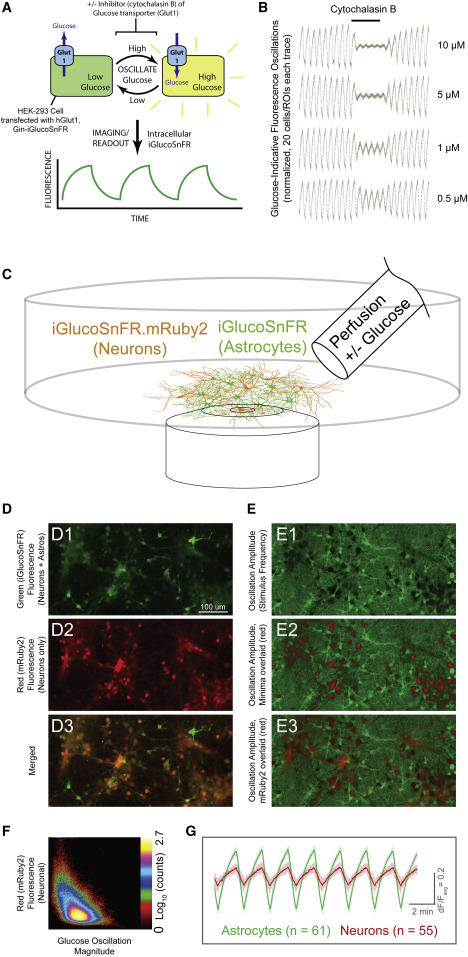
Fig. 2 (A) Schematic of transporter assay. Cultured cells (HEK293) were co-transfected with plasmids for expression of iGlucoSnFR and the human glucose uniporter hGlut1. Buffers were oscillated with and without glucose, eliciting oscillating fluorescence responses, which were subsequently diminished by overlaying constant concentrations of the glucose transporter inhibitor cytochalasin B at various concentrations. (B) Oscillating fluorescence responses and inhibition. Twenty regions of interest (ROIs) corresponding to cells were identified by fast Fourier transform (FFT) magnitude in initial segments without inhibitor and were filtered over the whole experiment by subtraction of a moving-window average of length corresponding to the stimulus period. Each trace was then normalized by root-mean-square deviation (RMSD) during the pre-treatment phase and plotted as individual data points. In the middle segment (indicated at top), cytochalasin B was added at the concentrations indicated at the right of each trace. After removing cytochalasin B, oscillation magnitudes returned to initial values. Imaging parameters were: two channels: excitation (Ex) 488 nm, emission (Em) 505–550; Ex 561, Em 565–650; objective EC Plan-Neofluar 10×/0.3 numerical aperture (NA) M27, imaging rate ∼1 Hz; 512 × 512 pixels; stimulus period 60 s. (C) Schematic of neuronal culture assay. Acute astrocyte-neuron co-cultures from rat hippocampus were infected with AAVs driving iGlucoSnFR-mRuby2 expression in neurons (hSynapsin-1 promoter) and green-only iGlucoSnFR in astrocytes (gfaABC1D promoter). ACSF + 20 mM glucose or sorbitol was continuously perfused, and fluorescence changes were measured. (D and E)) Fluorescence imaging of co-cultures. (D1–D3) Fluorescence images for each channel are shown as indicated. (E1–E3) Images of pixelwise temporal FFT magnitudes at stimulus frequency, indicative of glucose concentration changes. E1 shows amplitudes in green. E2 shows the same image but with FFT minima overlaid in red, for comparison with the mRuby2 signals overlaid in E3 (also see alone in D2). Two channels: Ex 488 nm, Em 505–550; Ex 561, Em 565–650; objective Plan-Apochromat 20×/0.8 NA M27, imaging rate ∼1 Hz; 1,024 × 512 pixels; stimulus period 120 s. (F) Correlation plot between FFT magnitude (x axis) and mRuby2 signal (y axis). Note clear (albeit weak) anti-correlation between the two (correlation coefficient [CC] of ∼−0.5): high intensity in the red channel corresponds to weak magnitudes and vice versa. (G) Averaged fluorescence responses (ΔF/Favg) to oscillating stimulus from astrocytes (identified by high-thresholded green/red fluorescence ratio) and neurons (identified by high red fluorescence signals). ΔF/Favg was calculated by subtraction of a moving window average with size corresponding to the period of the stimulus oscillations followed by division by the same moving average. Note the larger magnitude of glucose response in astrocytes. Error bars represent SD in fluorescence responses within each group. Nearly identical results with reversed tags are shown in Figure S2.