
Fig. 1
- ID
- ZDB-FIG-220113-17
- Publication
- Keller et al., 2021 - In vivo glucose imaging in multiple model organisms with an engineered single-wavelength sensor
- Other Figures
- All Figure Page
- Back to All Figure Page
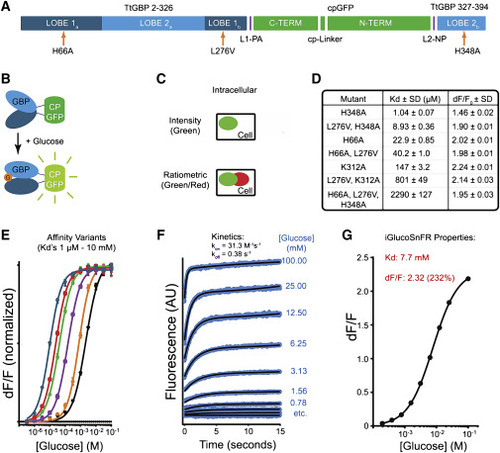
(A) Schematic of iGlucoSnFR sensor sequence. Circularly permuted green fluorescent protein (cpGFP, green) was inserted into glucose-binding protein (GBP, light and dark blue) from T. thermophilus. Affinity-lowering mutations are indicated (orange arrows). “LOBEs” refer to the two subdomains on opposing sides of the ligand-binding pocket of GBP. (B) Schematic of iGlucoSnFR sensor construction. cpGFP (green) was inserted into GBP (light and dark blue) from T. thermophilus such that binding of glucose (G, orange disk) to GBP induced fluorescence increases in cpGFP. (C) Sensor architecture. Sensors were made with the addition of a glucose-insensitive red fluorescent protein mRuby2 to allow for ratiometric measurements and/or cell typing. Sensors are shown schematically as green ellipses; mRuby2 is shown as red ellipses. (D and E) Affinity variants. Permutations of binding site residue mutations (H66A, L276V, K312A, H348A) yielded iGlucoSnFR variants with affinities spanning the range of 1 μM to 10 mM when measured in PBS. Each curve in (E) represents a sensor with different affinity, with fluorescence changes normalized by lowest and highest values. The last entry in (D) (H66A, L276V, H348A) and the rightmost curve in (E) represent iGlucoSnFR as used in the rest of the text. Values are mean ± SD of n = 3 experimental replicates. (F) iGlucoSnFR kinetics. Stopped-flow fluorescence measurements on the final construct were performed at several concentrations, and kinetic rate constants were fit to data. Values are mean ± SD of n = 5 experimental replicates. (G) Final iGlucoSnFR binding curve, constructed from the data in (F). Sensor parameters are as shown. Note that these data were collected at pH 8.2 to increase ΔF/F for kinetics accuracy, thus increasing the KD relative to neutral pH. Error bars (SD) are plotted, but they are hidden by the symbols. Values are mean ± SD of n = 3 experimental replicates. |