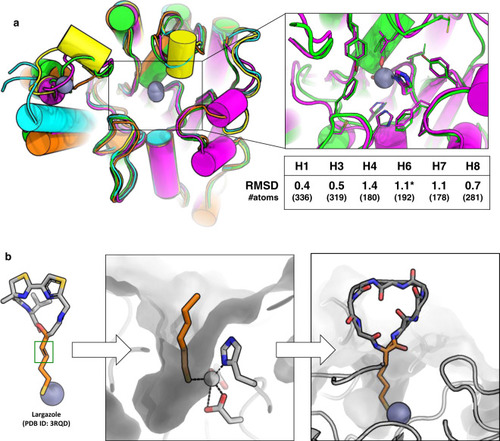
Anchor extension based design of macrocycles targeting HDAC2.
a Top left: Overlay of crystal structures of several HDACs showing the secondary structure elements adjacent to the active site (box on left) and their RMSD to HDAC2 (H1 = HDAC1, H3 = HDAC3, H4 = HDAC4, H6 = HDAC6, H7 = HDAC7, H8 = HDAC8). RMSD is calculated over the conserved secondary structure elements shown in the figure. Number of atoms in the aligned region is mentioned in the table. HDAC2 (green, PDB ID: 5IWG), HDAC4 (cyan, PDB ID: 2VQO), HDAC6 (magenta, PDB ID: 6R0K), HDAC7 (yellow, PDB ID: 3C0Z), HDAC8 (orange, PDB ID: 3SFF). All structures shown here are human variants except HDAC6 (shown by an asterisk), which is the homolog from Danio rerio. The inset on top right shows the overlay of the active site residues of HDAC2 (green) and HDAC6 (magenta). The residues coordinating the active site Zn (gray sphere) are shown in sticks. b Schematic representation of anchor-extension approach. The SHA (2S-2-amino-7-sulfanylheptanoic acid) anchor was inspired by the long tail of the HDAC-binding small molecule Largazole and modeled in HDAC2 pocket. A double bond in Largazole (green box) was replaced by a single bond in SHA to allow synthesis. Low-energy bound conformations were sampled using molecular dynamics simulations and served as starting points for designing new macrocycle binders.
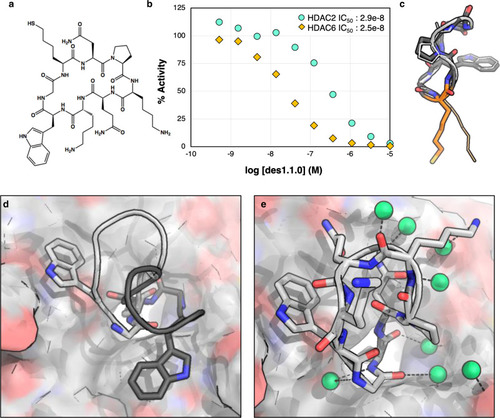
Crystal structure of des1.1.0 has the designed monomer structure but adopts a different binding orientation.
a Chemical structure of des1.1.0. b des1.1.0 inhibits HDAC2 with an IC50 of 289 nM (Source Data are provided as a Source Data file). c Overlay of the designed peptide model des1.1.0 (dark gray) with the crystal structure (light gray). Some sidechains are removed for clarity. SHA anchor is shown in orange. d Overlay of des1.1.0 binding mode in original computational design (dark gray) and crystal structure (light gray) shows a clear rotation around SHA—Zn2+ axis in the binding pocket. e Crystal structure of des1.1.0 (PDB ID: 6WHO) shows several water-mediated interactions at the interface. Water molecules are shown as green spheres.
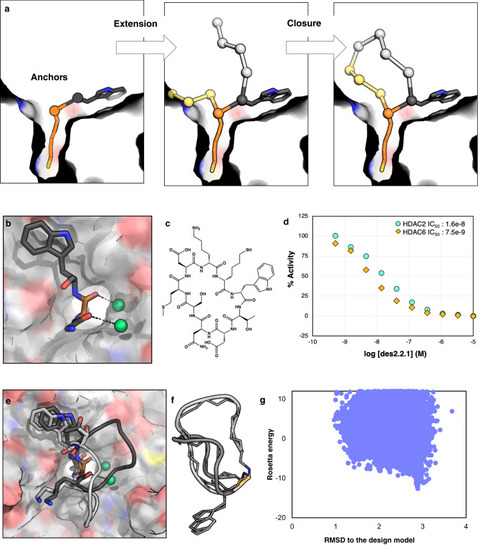
Design method 2 results in peptides that bind in predicted mode by taking advantage of an additional anchor and including waters.
a Schematic of design method 2: anchors are extended, and the new peptide chain is closed inside the protein pocket. b In this round of designs, a Trp residue was added as an anchor in addition to SHA, and the backbone orientation of SHA and the preceding residue were fixed to orient two structural waters at the interface. c Chemical structure of des2.1.1. d des2.1.1 has an IC50 value of 16.3 nM against HDAC2 and slight preference for HDAC6 over HDAC2 (Source Data are provided as a Source Data file). e Crystal structure of des2.1.1 (PDB ID: 6WI3, light gray) shows a conformation consistent with the designed model for SHA, Trp, and waters at the interface; however, the rest of the peptide shows higher flexibility. The original model is shown in dark gray. f The binding-competent backbone conformation from the crystal structure (light gray) is different from the NMR structure of the peptide in solution (dark gray), suggesting a conformational change upon binding. Both of these structures differ from the design model. The sidechains, except for Trp are removed for clarity. g The flexibility of des2.1.1 is consistent with conformational sampling results, suggesting that this peptide can sample a number of different conformational states far from the designed model (Source Data are provided as a Source Data file).
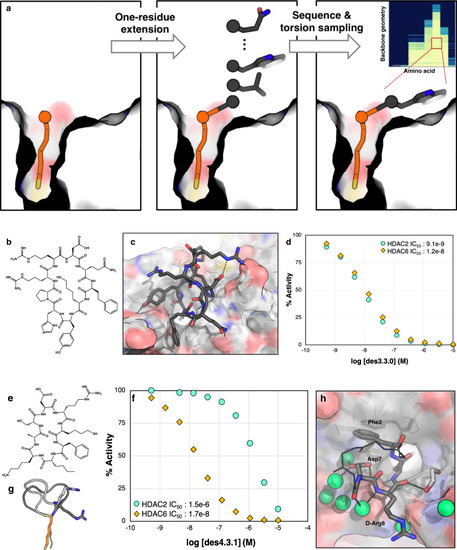
Design methods 3 and 4 generate cyclic peptides with higher shape complementarity to the binding pocket and better overall potencies.
a Schematic description of methods 3 and 4: the anchor is extended one residue before and after, and for each residue, backbone torsions are sampled. For each backbone geometry, the interface metrics are calculated for different amino acid substitutions for that residue. Inset: Example of ∆∆G distribution for a single residue position for different backbone geometries and amino acid choices. Backbone phi/psi distribution were sampled on 30˚ grids (each row is a different phi/psi bin), and the free energy of HDAC binding computed for different amino acid possibilities (y axis). ∆∆Gs are indicated in colors from light yellow (most favorable) to dark blue (most unfavorable). The best combinations of torsion and amino acid are then used for extension of the peptide sequence, closure, and design. b Chemical structure of des3.3.0 and c its computational model at the HDAC2 interface. d des3.3.0 has an IC50 of 9.1 nM for HDAC2 and 12 nM for HDAC6 (Source Data are provided as a Source Data file). e Chemical structure of des4.3.1. f des4.3.1 inhibits HDAC6 with an IC50 value of 17 nM, 88 times better than its potency for HDAC2 (Source Data are provided as a Source Data file). g Crystal structure of bound des4.3.1 (PDB ID: 6WSJ, light gray) is different from the designed model (dark gray). d-Arg8 (shown as sticks) adopts a negative phi torsion, a geometry more consistent with l-Arg. h Crystal structure of des4.3.1 (PDB ID: 6WSJ) complexed with HDAC6. The HDAC6 structure shows minimal change upon binding (RMSD of 0.17 Å for 302 Cα atoms compared with the apo-structure, PDB ID: 5EEM). The non-interacting residues are shown as lines and their side-chains are omitted for clarity. Water molecules are shown as green spheres.
Improvements in scoring, structure sampling, and binding orientation sampling should increase design binding affinity and selectivity.
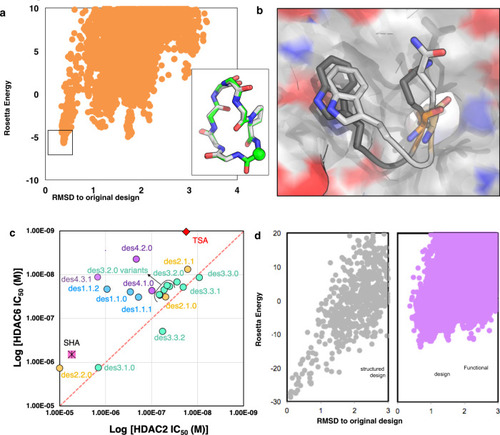
a Conformational sampling of des1.1.0 (Source Data are provided as a Source Data file). Inset: Overlay of the crystal structure (gray) and the best scoring model (green). The CA atom of the SHA anchor is shown as sphere for reference. b Overlay of predicted binding orientation from our large-scale parallel docking (dark gray) with crystal structure (light gray) of des1.1.0 shows that docking can accurately predict orientation of key residues at the interface. c Despite improvement of the IC50 values over the original SHA anchor (pink square), most designs follow the same trend as SHA; binding slightly more tightly to HDAC6 over HDAC2. Different colors show results of designs from different methods (blue = method 1, orange = method 2, green = method 3, purple = method 4). TSA (Trichostatin A, red diamond), a pan-HDAC inhibitor, is shown as a control. d Comparison of computational conformational sampling for a structured (gray) and a functional (purple) macrocycle shows a much deeper energy gap for structured macrocycle compared to the functional macrocycle (Source Data are provided as a Source Data file).
Acknowledgments
This image is the copyrighted work of the attributed author or publisher, and
ZFIN has permission only to display this image to its users.
Additional permissions should be obtained from the applicable author or publisher of the image.
Full text @ Nat. Commun.
Your Input Welcome
Thank you for submitting comments. Your input has been emailed to ZFIN curators who may contact you if
additional information is required.
Oops. Something went wrong. Please try again later.