
Fig. 5
- ID
- ZDB-IMAGE-210617-13
- Publication
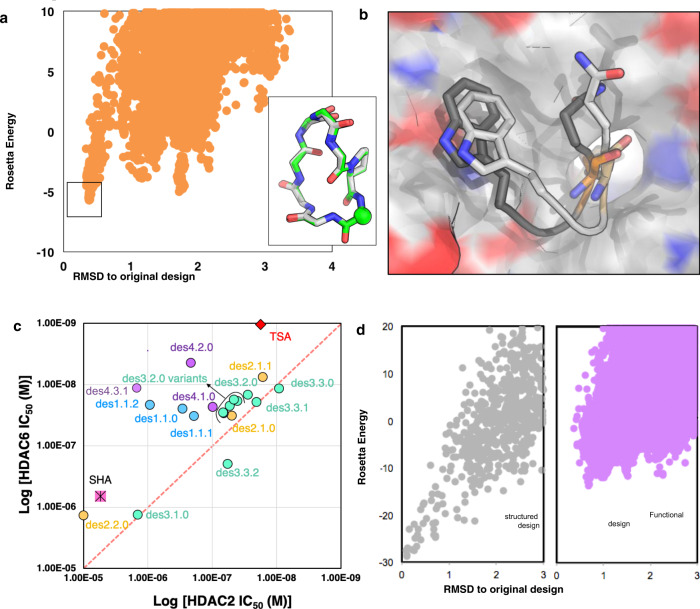
- Hosseinzadeh et al., 2021 - Anchor extension: a structure-guided approach to design cyclic peptides targeting enzyme active sites
- All Figures
- Figures for Hosseinzadeh et al., 2021
|
Fig. 5