FIGURE SUMMARY
Title

Functional in vivo characterization of sox10 enhancers in neural crest and melanoma development

Authors
Cunningham, R.L., Kramer, E.T., DeGeorgia, S.K., Godoy, P.M., Zarov, A.P., Seneviratne, S., Grigura, V., Kaufman, C.K.
Source
Full text @ Commun Biol

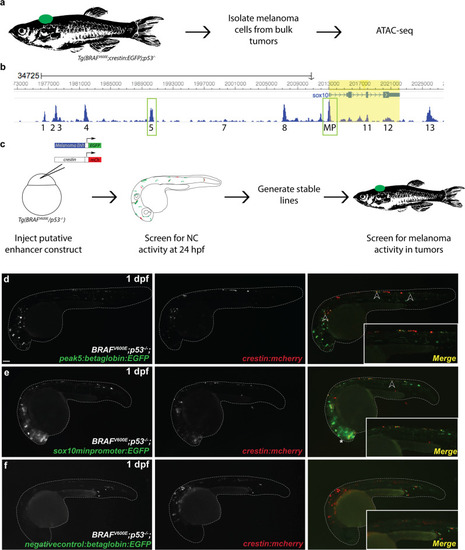
ATAC-Seq of zebrafish melanoma tumors identifies <italic>peak5</italic> as an active neural crest enhancer.

a Schematic for obtaining zebrafish melanoma tumor cells for ATAC-Seq. b Regions of open chromatin surrounding the sox10 locus. Peak numbers are annotated below. MP minimal promoter. c Schematic for screening putative enhancers for activity in NCCs and melanoma. dpeak5-driven EGFP expression is mosaically present in NCCs (arrowheads) in F0 injected embryos, as indicated by co-localization with crestin:mch at 1 dpf. e The sox10 minimal promoter in F0 embryos is active in both NCCs (arrowheads) and the CNS (asterisk). f F0 embryos injected with a negative control (~76 kb upstream of the sox10 TSS) exhibit only limited expression of EGFP not localized to NCCs. Insets show enlarged region above yolk extension.

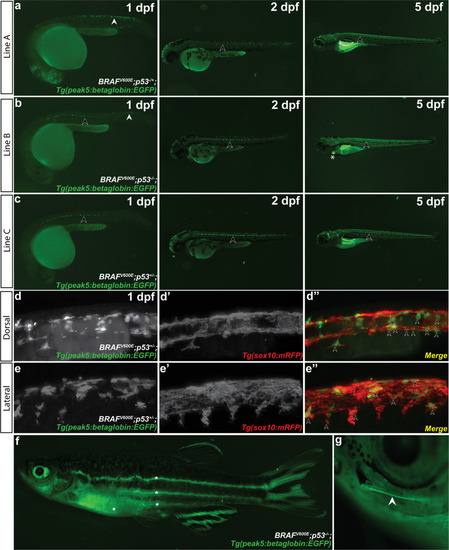
<italic>peak5</italic> stable transgenic lines exhibit similar expression patterns in subsets of NCCs and neural crest derivatives.

Multiple transgenic lines derived from independent founder (F0) parental fish were established that transmit the peak5:betaglobin:EGFP reporter through the germline. White arrowheads indicate NCCs. Black arrowheads point to KA neurons. Asterisks indicate heart EGFP localization in the heart. a Stable line A exhibits strong EGFP localization in NCCs at 1 dpf. At 2 dpf, some NCCs are labeled, and KA neurons are also faintly visible. At 5 dpf, the most prominently labeled cells are KA neurons and cells near or within the swim bladder. b At 1 dpf, Line B exhibits EGFP localization in posterior premigratory NCCs and strong localization in KA neurons. By 3 and 5 dpf, EGFP localization is primarily within KA neurons and the heart. c Line C mainly exhibits EGFP localization in KA neurons at 1, 2, and 3 dpf. d Lightsheet microscopy of the dorsal aspect of peak5:betaglobin:EGFP Line A embryos shows peak5 is active in cells with NCC morphology and premigratory NCC localization at 1 dpf and d′–d″ co-labels with Tg(sox10(7.2):mRFP) positive cells. Arrowheads point to representative co-labeled cells. The lateral aspect also shows ee″ EGFP positive cells that co-localize with mRFP positive cells. Arrowheads point to representative co-labeled cells. f Whole animal image of peak5 active in stable transgenic line A. Asterisks (*) indicate regions of auto-fluorescence; a long pass filter set allows discrimination between the yellow hue of autofluorescent tissue and EGFP-expressing cells. g EGFP positive cells peripheral nervous system cells within the barbel (arrowhead).

<italic>peak5</italic> is active in melanoma tumors across multiple stable lines and in melanoma precursor lesions.

a, b Bright-field images of tumors, circled, in Tg(peak5:betaglobin:EGFP) stable line A in the Tg(BRAFV600E);p53−/− zebrafish background. a′, b′ Tumors are EGFP positive and EGFP is highly expressed in tumors compared to any low EGFP expression elsewhere in the fish. c, d Bright-field images of Tg(peak5:betaglobin:EGFP) stable line B with tumors, circled. c′, d′ Tumors are EGFP positive. e, f Bright-field images of Tg(peak5:betaglobin:EGFP) stable line C with tumors, circled. e′, f′ Tumors are EGFP positive. gTg(peak5:betaglobin:EGFP) stable line A zebrafish with dorsally located melanoma precursor lesion that grows over time. hTg(peak5:betaglobin:EGFP) stable line B zebrafish with a melanoma precursor lesion in a scale that expands in size over time. iTg(peak5:betaglobin:EGFP) stable line B zebrafish with precursor lesion located on the tail that grows over time. jTg(peak5:betaglobin:EGFP) stable line C zebrafish with a precursor lesion on the tail that grows into a tumor. Day 0 denotes the first day the precursor lesion was observed.

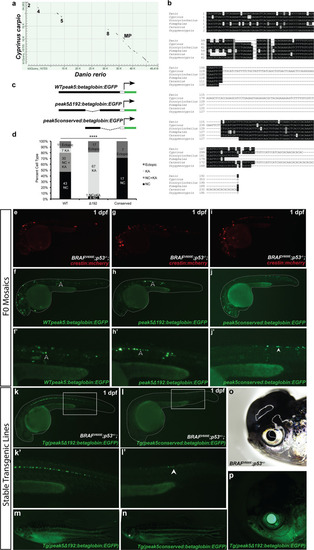
A conserved region of <italic>peak5</italic> is necessary for neural crest and melanoma activity.

a Dot-matrix view of the alignment of the carp (Cyprinus carpio) sox10 coding and surrounding noncoding genomic region of sox10 compared to the same genomic region in zebrafish (Danio rerio). Numbers indicate regions where peak sequences are conserved. MP minimal promoter. b Sequence alignment of the most conserved region of peak5 to members of the Cyprinidae family. c Schematic of plasmids used in the experiment. d Quantification of the percentage of categorizable EGFP + embryos exhibiting NC, KA, or both NC and KA labeling, or ectopic expression in screened WT peak5 (n = 91), peak5Δ192 (n = 89), and peak5_conserved (n = 24) injected embryos. NC neural crest. KA Kolmer–Agduhr neurons. ****p-value <0.0001, Chi-squared analysis. Injection of crestin:mCherry simply served as a positive injection control in this experiment. ecrestin:mch expression in an embryo injected with WT peak5 and crestin:mch. fWT peak5 is active in both neural crest and f′ KA neurons. gcrestin:mch expression in an embryo injected with peak5Δ192 and crestin:mch. hpeak5Δ192 is not active in NCCs, but h′ is active in KA neurons. icrestin:mch expression in an embryo injected with the conserved peak5 sequence and crestin:mch. j The conserved peak5 sequence is active in neural crest and j′ does not exhibit activity in KA neurons. Black arrowheads indicate KA neurons and white arrowheads indicate NCCs. kkTg(peak5Δ192:EGFP) embryos exhibit EGFP localization in KA neurons, but no overt localization in NCCs in the trunk is observed. ll′ Contrastingly, Tg(peak_conserved:EGFP) embryos do not have labeled KA neurons, but exhibit EGFP positive cells in the trunk of the embryo (white arrowhead). m Little EGFP localization is observed in Tg(peak5Δ192:EGFP) adult fish whereas n cells within the maxillary barbels (asterisk) of Tg(peak_conserved:EGFP) are EGFP positive. o, p The majority of tumors that develop in Tg(peak5Δ192:EGFP) are EGFP negative.

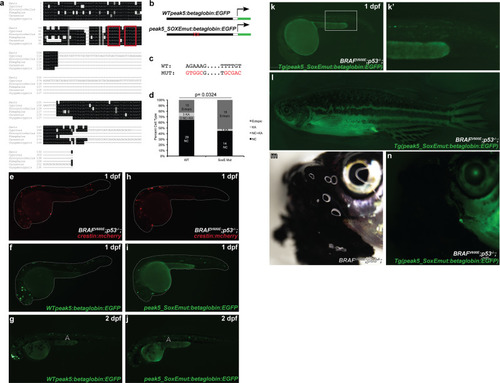
Mutation of dimeric SoxE TFBS affect <italic>peak5</italic> neural crest activity.

a Dimeric SoxE TFBS, as predicted by JASPAR (outlined in red), are present in the conserved sequence of peak5. b Schematic of plasmids used in the experiment. Mutations to SoxE TFBS were made in the context of the full-length WT peak5 plasmid. c Five out of six nucleotides for each motif were mutated. d Quantification of the percentage of categorizable EGFP + embryos exhibiting NC, KA, both NC, and KA, or ectopic expression in screened WT peak5 (n = 45) and peak5_SoxEmut (n = 31) injected embryos. NC neural crest, KA Kolmer–Agduhr neurons. p-value = 0.0324, Fisher’s exact test. Injection of crestin:mCherry simply served as a positive injection control in this experiment. ecrestin:mch expression in an embryo injected with WT peak 5 and crestin:mch. fWT peak5 is strongly active in neural crest in F0 mosaics at 1 dpf. gWT peak5 is strongly active in neural crest-derived cells and KA neurons at 2 dpf. hcrestin:mch expression in an embryo injected with peak5_SoxEmut and crestin:mch. ipeak5_SoxEmut is not active in the neural crest in F0 mosaics, but j is active in KA neurons. Arrowheads indicate KA neurons. kk′ Stable transgenic peak5_SoxEmut lines exhibit peak5 activity in KA neurons, but do not exhibit labeling in posterior premigratory neural crest cells. l Adult stable transgenic lines do not exhibit peak5 activity in barbel peripheral nerves. m, n Tumors that develop in Tg(peak5_SoxEmut:EGFP) lines are EGFP negative.

In vivo CRISPR/Cas9 deletion of <italic>peak5</italic> affects <italic>sox10</italic> expression and adult stripe patterning.

a 1 dpf CRISPR/Cas9 injected embryos with sgRNAs targeting the sox10 minimal promoter show DNA laddering (arrowheads) as compared to control injected embryos. b CRISPR/Cas9 injected embryos with sgRNAs targeting peak5 show complete disruption of the wild-type locus as evidenced by DNA laddering (arrowheads) compared to Cas9 injected embryo. c The stl792 allele contains a 200 bp deletion at the sox10 minimal promoter locus, which contains the TSS of sox10. d The stl538 allele contains 369 bp deletion at the peak5 locus, mainly disrupting the conserved region of peak5. e WISH for sox10 mRNA shows robust expression in wild-type 1 dpf embryos and f absent expression in stl729 homozygous mutant 1 dpf embryos. g Quantification of WISH expressing the percent of embryos displaying either “strong, “reduced,” or “absent” sox10 expression. p < 0.0001, Fisher’s exact test. h WISH for sox10 mRNA shows robust expression in wild-type 1 dpf embryos and i reduced expression in stl538 homozygous mutant 1 dpf embryos. j Quantification of WISH expressing the percent of embryos displaying either “strong, “reduced,” or “strongly reduced” sox10 expression. p = 0.0019, Fisher’s exact test. k Lateral view of one side of a wild-type Tg(BRAFV600E);p53−/ adult fish with 1 stripe break (arrowhead) compared to l a stl538 homozygous adult fish with 3 stripe breaks (arrowheads). m Quantification of the number of stripe breaks per fish. Each dot represents one fish. Wild-type fish exhibit a median of 1 stripe break per fish, IQR 0–2. stl538 homozygous fish exhibit a median of 4 stripe breaks per fish, IQR 3–8. *****p < 0.0001, Welch’s t-test. n Lateral view of one side of a wild-type Tg(BRAFV600E);p53−/− adult fish with 1 stripe break (arrowhead) compared to o a peak5stl538 heterozygote with two stripe breaks (arrowheads), p a sox10minstl792 heterozygote with 3 stripe breaks (arrowheads) and q a peak5stl538;sox10minstl792 trans-heterozygote with 5 stripe breaks (arrowheads). r Quantification of the number of stripe breaks per fish. Each dot represents one fish. Wild-type fish exhibit a median of 0 stripe breaks, IQR 0–3.25. peak5stl538 heterozygotes exhibit a median of 3 stripe breaks, IQR 1.5–4. sox10minstl792 heterozygotes exhibit a median of 5.5 stripe breaks per fish, IQR 3.75–8.25. peak5stl538/+;sox10minstl792/+ trans-heterozygotes exhibit a median of 9.5 stripe breaks per fish, IQR 7.75–12.75. *p < 0.05, **p = 0.001, ***p < 0.0002, Welch’s t-test. s In our model, peak5 activates sox10 expression in NCCs during development and then again in melanoma precursor cells, likely through dimeric SoxE TFBS. This leads to upregulation of neural crest-related genes and melanoma onset. tpeak5 is most likely not the only sox10 enhancer that regulates sox10 expression. Multiple elements within the sox10 super-enhancer may coordinate together to upregulate sox10 expression during melanoma initiation.

Acknowledgments
This image is the copyrighted work of the attributed author or publisher, and ZFIN has permission only to display this image to its users. Additional permissions should be obtained from the applicable author or publisher of the image. Full text @ Commun Biol