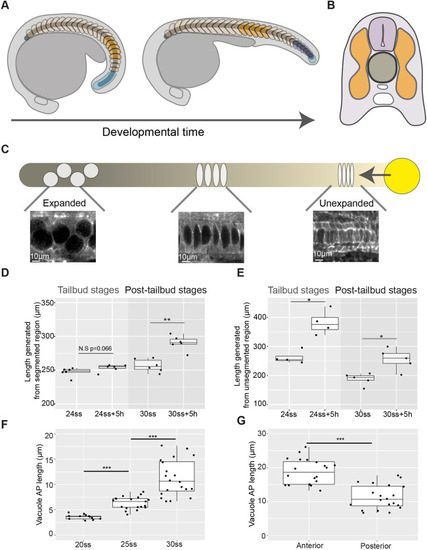
Axis elongation occurs predominantly in the unsegmented region during tailbud stages and later continues in segmented tissue in zebrafish embryos. (A) Schematic outlining segmented (orange and dark-blue) and unsegmented (light-blue) regions of the somitic compartment. Dark-blue somites are formed from unsegmented tissue as development progresses. (B) Schematic showing axial tissues in a cross-section of the zebrafish embryo. The notochord (dark-grey) is flanked on either side by the somitic compartment (orange) and dorsally by the neural tube (light-purple). (C) Schematic outlining events in notochord morphogenesis. Vacuolation progresses from the anterior (darker) to posterior (lighter) of the notochord and progenitors expressing noto (yellow) add cells to the notochord rod. (D) Length of a region of segmented tissue in tailbud (24ss) and post-tailbud (30ss) embryos and length generated from this region over 5 h (n=6 and n=6, respectively; **P<0.01, Mann–Whitney U test). (E) Length of a region of unsegmented tissue in tailbud (24ss) and post-tailbud (30ss) embryos and length generated from this region over 5 h (n=4 and n=5 embryos per stage, respectively; *P<0.05, Mann–Whitney U test). (F) AP length of vacuoles at different stages of development (n=3, n=4 and n=4 embryos per stage, respectively, 3-5 vacuoles measured per embryo; ***P<0.001, Kruskal–Wallis test). (G) AP length of vacuoles in anterior and posterior regions of 30ss embryos (n=4 embryos, 5 vacuoles measured per region; ***P<0.001, Mann–Whitney U test). Anterior is to the left and posterior to the right in all images. N.S., not significant.

Notochord cell expansion leads to the posterior displacement of notochord cells relative to adjacent axial tissues in zebrafish embryos. (A) Photolabelled stripes (magenta) along the length of an embryo expressing NLS-KikGR at 28ss and 5 h later. White dashed lines in insets show the notochord. (B) Shift between notochord and somite photolabels versus distance from the posterior end of the embryo. (C) Shift between notochord and neural tube photolabels versus distance from the posterior end of the embryo. Black dots indicate measured label shifts, solid line indicates linear regression line and grey shading indicates 95% confidence interval. (D) DAPI and Shh expression in representative control and ablated embryos (n=4 embryos per condition). The boxed area indicates the ablated region. (E) Schematic showing the ablated region (pink) in an embryo entering the post-tailbud stage. Ablations were made at the onset of vacuolation. (F) Expanding notochord cell tracks (track start: dark blue; track end: light green) in control and ablated embryos. Yellow arrows indicate direction of tracks. Pink dashed lines indicate ablated region. (G) Displacement of manually tracked expanded notochord cells in control and ablated embryos (n=6 embryos per condition, 3 tracks per embryo). (H) Displacement of manually tracked unexpanded notochord cells in control and ablated embryos (n=5 embryos per condition, 3 tracks per embryo).

Notochord cell expansion contributes to segmented tissue elongation during post-tailbud stages in zebrafish embryos. (A) Schematic showing the ablated region (pink) and region tracked for measuring segmentation-associated elongation (blue) in the developing embryo. (B) Control and ablated LIFEACT-GFP-expressing embryos imaged at the 25ss and 100 min later. Overlaid blue curves show the region tracked for elongation measurements. The pink line indicates the region where the notochord was ablated. (C) Percentage elongation of the tail region in control and ablated embryos (n=14 control embryos, n=11 ablated embryos, P=0.37). N.S., not significant (Mann–Whitney U test). (D) Length gained in the posterior tail of tailbud-stage control and ablated embryos over time. (E) Schematic showing the ablated region (pink) and region tracked for measuring segmented tissue elongation (orange). (F) Elongation of a five-somite region in control and ablated post-tailbud stage LIFEACT-GFP-expressing embryos. Pink dashed arrows indicate the length of the measured region and yellow dashed lines indicate the anterior and posterior extents of the measured region. (G) Percentage elongation of a five-somite region in control and ablated post-tailbud-stage embryos over a period of 5 h (n=14 control and n=11 ablated embryos; **P<0.001, Mann–Whitney U test). (H) Length gained in a five-somite region in control and ablated post-tailbud-stage embryos over time. (I) Length of a five-somite region in representative DMSO and bafilomycin-treated post-tailbud-stage embryos. Pink dashed arrows indicate the length of the measured region.

Notochord progenitors provide a source of resistance to notochord cell expansion, facilitating segmented tissue elongation in zebrafish embryos. (A) DAPI-stained notochord nuclei located in the anterior tail region in fixed control and ablated embryos. The angle between dorsally located nuclei and the notochord AP axis is indicated in yellow. (B) Polar histogram showing the distribution of angles between dorsally located nuclei and the notochord AP axis in control and ablated embryos (n=12 embryos per condition, five angles measured per embryo; P<0.001). (C) Schematic showing the ablated posterior unexpanded region (pink) and region used for measuring segmented-tissue elongation (orange). (D) Manual tracking (green-blue lines) of expanding notochord cells in a representative control and posteriorly-ablated embryo. Yellow arrows indicate direction of cell movement. (E) Vinculin and DAPI immunostaining in representative anterior and posterior notochord regions. Yellow arrows mark the dorsal (top) and ventral (bottom) extents of the notochord. (F) Elongation of a five-somite region in control and posteriorly ablated post-tailbud-stage embryos. The yellow dashed lines indicate the anterior and posterior extent of measured regions and the pink dashed arrows indicate the length of the measured region. (G) Notochord cell displacement over time in control and posteriorly ablated embryos (n=4 and n=5 embryos, respectively, 3 tracks per embryo). (H) Percentage elongation of a five-somite region in control and posteriorly ablated embryos (n=8 and n=7 embryos, respectively; **P<0.01, Mann–Whitney U test). (I) Notochord cell expansion progresses posteriorly along the axis. Expanding cells (pink) push against resisting unexpanded notochord cells (blue) added by posterior notochord progenitors (green), generating a stress along the notochord. (J) The somitic compartment anterior to the posterior resistance point undergoes an AP stretch (indicated by the black arrows). Tissue coupling between notochord cells and the somitic compartment is proposed to occur in the posterior of the embryo.

Acknowledgments
This image is the copyrighted work of the attributed author or publisher, and ZFIN has permission only to display this image to its users. Additional permissions should be obtained from the applicable author or publisher of the image. Full text @ Development