IMAGE

Fig. 2.

ID
ZDB-IMAGE-210805-2
Source
Figures for McLaren et al., 2021
Image
Figure Caption

Fig. 2.

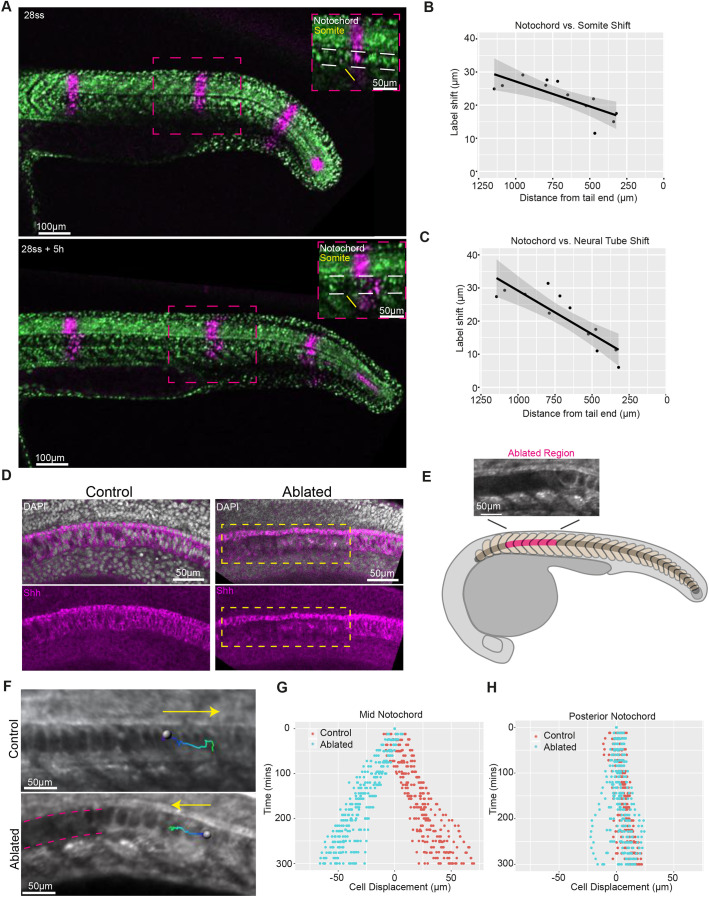
Notochord cell expansion leads to the posterior displacement of notochord cells relative to adjacent axial tissues in zebrafish embryos. (A) Photolabelled stripes (magenta) along the length of an embryo expressing NLS-KikGR at 28ss and 5 h later. White dashed lines in insets show the notochord. (B) Shift between notochord and somite photolabels versus distance from the posterior end of the embryo. (C) Shift between notochord and neural tube photolabels versus distance from the posterior end of the embryo. Black dots indicate measured label shifts, solid line indicates linear regression line and grey shading indicates 95% confidence interval. (D) DAPI and Shh expression in representative control and ablated embryos (n=4 embryos per condition). The boxed area indicates the ablated region. (E) Schematic showing the ablated region (pink) in an embryo entering the post-tailbud stage. Ablations were made at the onset of vacuolation. (F) Expanding notochord cell tracks (track start: dark blue; track end: light green) in control and ablated embryos. Yellow arrows indicate direction of tracks. Pink dashed lines indicate ablated region. (G) Displacement of manually tracked expanded notochord cells in control and ablated embryos (n=6 embryos per condition, 3 tracks per embryo). (H) Displacement of manually tracked unexpanded notochord cells in control and ablated embryos (n=5 embryos per condition, 3 tracks per embryo).

Acknowledgments
This image is the copyrighted work of the attributed author or publisher, and ZFIN has permission only to display this image to its users. Additional permissions should be obtained from the applicable author or publisher of the image. Full text @ Development