FIGURE SUMMARY
Title

Osteocytes as main responders to low-intensity pulsed ultrasound treatment during fracture healing

Authors
Shimizu, T., Fujita, N., Tsuji-Tamura, K., Kitagawa, Y., Fujisawa, T., Tamura, M., Sato, M.
Source
Full text @ Sci. Rep.

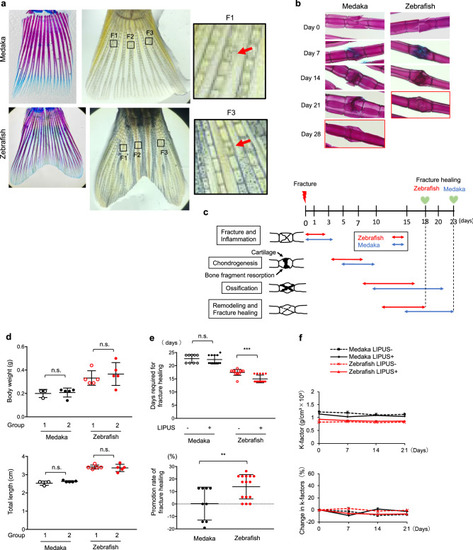
The effect of LIPUS treatment on fracture healing in medaka and zebrafish (a) Left: Tail bones of medaka and zebrafish stained by Alcian blue and Alizarin red. Middle: In tail bones of zebrafish and medaka, three fractures (F1, F2 and F3) per fish were induced with a scalpel under a microscope. Right: High magnification images of the boxed regions (medaka F1, zebrafish F3) in middle panels. Original magnification 2× (left and middle panel), 10× (right panel). (b) Stained images of the fracture healing process in medaka and zebrafish without LIPUS stimulation. The fracture site was stained with Alcian blue and Alizarin red. Original magnification: 10×. (c) Schematic representation of sequence of fracture healing processes in medaka and zebrafish. Inflammation stage, soft callus formation stage (chondrogenesis), hard callus formation stage (ossification), and remodeling stage are indicated by arrows (Red arrows: zebrafish, Blue arrows: Medaka). (d) The body weight (upper panel) and total length (lower panel) of experimental group of medaka and zebrafish before the LIPUS application (n = 3–5). (e) Upper: Days required for complete fracture healing in LIPUS-treated and untreated medaka and zebrafish. Lower: Promotion rate of fracture healing induced by LIPUS stimulation in medaka and zebrafish (n = 3–5 fishes × 3 fractures, representative data). The time point that the fracture was completely healed was measured in a blinded manner. This experiment was repeated three times with similar results. (f) Upper: The body weight and length of the fish were measured every week, and the condition factor (K-factor; g/cm2 × 103) was calculated at the indicated points. Lower: Percent change in condition factor (n = 3–5). Data are presented as mean ± SEM. p Values ​​were determined using Student’s t-test. * p < 0.05, ** p < 0.01, *** p < 0.001.The photographs in (a) and (b) were taken by T. S.

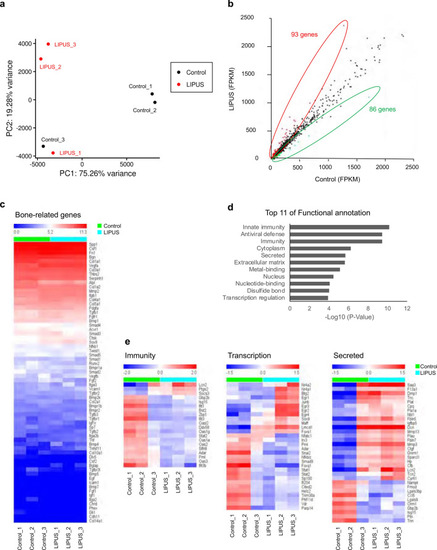
RNA-seq analysis of LIPUS-stimulated MLO-Y4 cells. (a) Principal Component Analysis (PCA) plot showing the variability between the biological replicates of control and LIPUS-treated MLO-Y4 cells. (b) Comparison of gene expression levels by scatter plot. In total, 179 genes were identified as significantly affected, of which 93 were upregulated (red outline) and 86 were downregulated (green outline) by LIPUS. (c) Heat map showing the change in expression of bone-related genes in LIPUS-treated and untreated MLO-Y4 cells. (d) Using the 179 affected genes, affected annotated term categories were identified. Log10 (p value) > 1.3 (p value < 0.05) was considered significantly different. (e) Heat map showing the change in expression of genes involved in immunity (left), transcription (center), and secretion (right) in LIPUS-treated and untreated MLO-Y4 cells (n = 3 biological independent samples per group). (a) was created by N. F. using PCAGO (https://pcago.bioinf.uni-jena.de). (b), (c) and (e) were created by N. F. using R programming language (v3.6.3; http://www.r-project.org). (d) was created by N. F. using DAVID (v6.8; https://david.ncifcrf.gov).

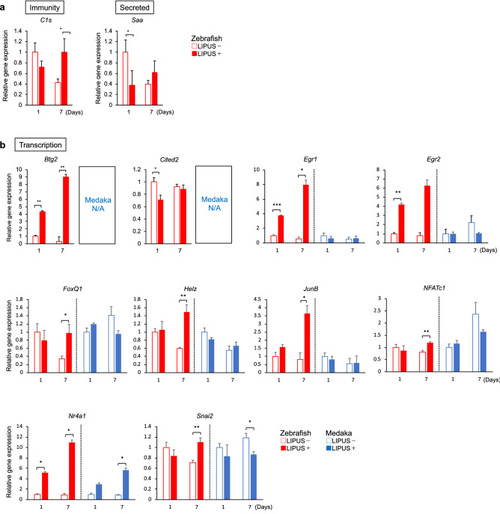
Measurement of candidate gene expression in LIPUS-treated zebrafish and medaka. Zebrafish and medaka tail bones were fractured and stimulated with LIPUS for 20 min every day. On days 1 and 7 after the fracture, RNA was extracted from the fin rays. (a) Immunity-, Secretion-, and (b) Transcription-related genes were measured (n = 3). For medaka, Btg2 and Cited2 couldn’t design qPCR primers because reference sequences were not available (N/A) in the public database. Values presented are the mean ± SEM and the significance of differences was determined using Student’s t-test. * p < 0.05; ** p < 0.01.

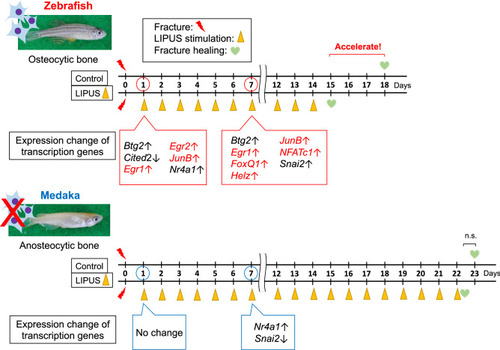
Schematic summary. Schematic representation of the LIPUS effect on the fracture healing and associated transcription factor genes in zebrafish which comprise osteocyte-containing bone and medaka which comprise osteocyte-lacking bone. The photographs of zebrafish and medaka were taken by M. S.

Acknowledgments
This image is the copyrighted work of the attributed author or publisher, and ZFIN has permission only to display this image to its users. Additional permissions should be obtained from the applicable author or publisher of the image. Full text @ Sci. Rep.