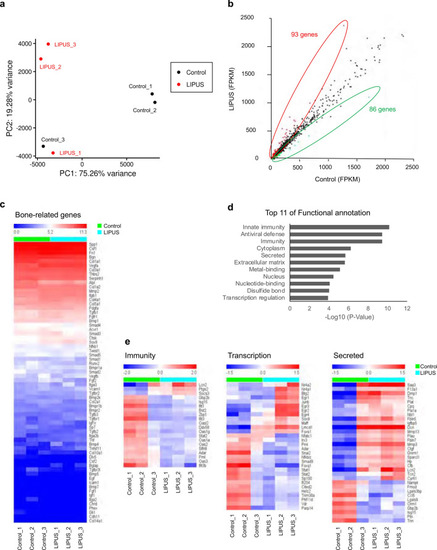
RNA-seq analysis of LIPUS-stimulated MLO-Y4 cells. (a) Principal Component Analysis (PCA) plot showing the variability between the biological replicates of control and LIPUS-treated MLO-Y4 cells. (b) Comparison of gene expression levels by scatter plot. In total, 179 genes were identified as significantly affected, of which 93 were upregulated (red outline) and 86 were downregulated (green outline) by LIPUS. (c) Heat map showing the change in expression of bone-related genes in LIPUS-treated and untreated MLO-Y4 cells. (d) Using the 179 affected genes, affected annotated term categories were identified. Log10 (p value) > 1.3 (p value < 0.05) was considered significantly different. (e) Heat map showing the change in expression of genes involved in immunity (left), transcription (center), and secretion (right) in LIPUS-treated and untreated MLO-Y4 cells (n = 3 biological independent samples per group). (a) was created by N. F. using PCAGO (https://pcago.bioinf.uni-jena.de). (b), (c) and (e) were created by N. F. using R programming language (v3.6.3; http://www.r-project.org). (d) was created by N. F. using DAVID (v6.8; https://david.ncifcrf.gov).
|
