
- Title
-
Isotope tracing in adult zebrafish reveals alanine cycling between melanoma and liver
- Authors
- Naser, F.J., Jackstadt, M.M., Fowle-Grider, R., Spalding, J.L., Cho, K., Stancliffe, E., Doonan, S.R., Kramer, E.T., Yao, L., Krasnick, B., Ding, L., Fields, R.C., Kaufman, C.K., Shriver, L.P., Johnson, S.L., Patti, G.J.
- Source
- Full text @ Cell Metab.
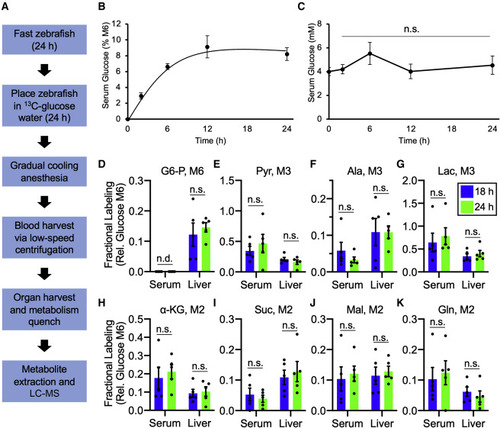
Adding isotope tracers to adult zebrafish water achieves isotopic steady-state labeling (A) Schematic of the steady-state labeling workflow for LC-MS-based metabolomics. (B) Kinetics to achieve steady-state labeling for serum glucose from WT zebrafish in tank water containing 10 mM [U-13C] glucose. Values are mean ± SEM; n = 3–4 zebrafish per time point. (C) Serum glucose levels in WT zebrafish over the course of 10 mM [U-13C] glucose labeling. Values are mean ± SEM; n = 3–4 zebrafish per time point. (D–G) Fractional labeling, relative to serum M6 glucose, of the glycolytic intermediates glucose 6-phosphate (D), pyruvate (E), alanine (F), and lactate (G) in WT serum and liver between 18 and 24 h. Data are mean ± SEM; n = 5 zebrafish per time point. (H–K) Fractional labeling, relative to serum M6 glucose, of the metabolites α-ketoglutarate (H), succinate (I), malate (J), and glutamine (K) in WT serum and liver between 18 and 24 h. Data are mean ± SEM; n = 5 zebrafish per time point. n.d., not detected; n.s., not statistically significant according to a two-tailed paired t test; G6-P, glucose 6-phosphate; Pyr, pyruvate; Ala, alanine; Lac, lactate; α-KG, α-ketoglutarate; Suc, succinate; Mal, malate; Gln, glutamine. Full labeling data are available in Data S1. |
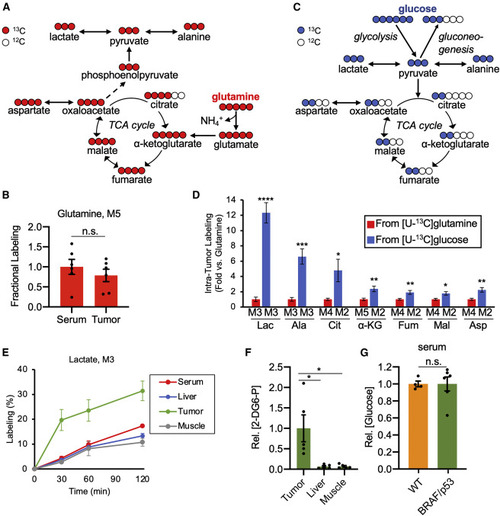
Glucose is a major carbon source for melanoma metabolism in vivo (A) Schematic to illustrate the transformation of glutamine carbon to key intermediates in central carbon metabolism. (B) Fractional labeling in tumor M5 glutamine, normalized to serum M5 glutamine, from a [U-13C] glutamine tracer. Values are mean ± SEM; n = 6 zebrafish. (C) Schematic to illustrate the transformation of glucose carbon to key intermediates in central carbon metabolism. (D) Comparison of the 13C-contribution from glucose and glutamine tracers to central carbon metabolites in melanoma. As expected, the isotopologues shown accounted for the majority of the labeling. Data shown here are presented as fold changes (i.e., the amount of labeling from [U-13C] glucose relative to the amount of labeling from [U-13C] glutamine, which is normalized to 1). Values are mean ± SEM; n = 6–10 zebrafish per condition. (E) Absolute enrichment of lactate (M3 isotopologue) over time in tissues from BRAF/p53 zebrafish following an intraperitoneal injection of [U-13C] glucose. Data are mean ± SEM; n = 3–4 zebrafish per time point. (F) Glucose uptake in tissues from BRAF/p53 zebrafish. Relative concentration of 2-deoxyglucose 6-phosphate (2-DG6-P) for tissues within a fish are normalized to the 2-DG6-P pool in its tumor. Values are mean ± SEM; n = 5–6 zebrafish per condition. (G) Relative pool size of circulating glucose in WT and BRAF/p53 fish, normalized to the WT group. Values are mean ± SEM; n = 4–6 zebrafish per condition. Statistically significant differences were assessed by a two-tailed paired t test and annotated as follows: ∗p < 0.05, ∗∗p < 0.01, ∗∗∗p < 0.001, ∗∗∗∗p < 0.0001, or n.s. = not significant. Lac, lactate; Ala, alanine; Cit, citrate; α-KG, α-ketoglutarate; Fum, fumarate; Mal, malate; Asp, aspartate. Full labeling data are provided in Data S2. |

Systems-level isotope tracing reveals elevated hepatic gluconeogenesis in BRAF/p53 fish, fueled by melanoma-derived alanine (A) Heatmap of normalized labeling differences in various metabolites from [U-13C] glucose. Differences were calculated by comparing the normalized labeling of a tissue from BRAF/p53 fish with the normalized labeling of the same tissue from WT fish. Green indicates increased labeling and red indicates decreased labeling in metabolites from BRAF/p53 fish. Each data point represents the ratio of means from biological replicates. White boxes denote metabolites that did not incorporate 13C tracer. n = 5–10 zebrafish per condition. The identities of each metabolite within the plot and full labeling data are available in Data S3. (B) Heatmap of metabolite pool-size differences in tissues from BRAF/p53 fish relative to tissues from WT fish. Green indicates larger pool size, and red indicates smaller pool size of metabolites from BRAF/p53 fish. Each data point represents the ratio of means from biological replicates. n = 5–10 zebrafish per condition. The identities of each metabolite within the plot and pool-size data are available in Data S3. (C) Relative concentration of hepatic glycogen in WT and BRAF/p53 fish, normalized to the WT group. Values are mean ± SEM; n = 7 zebrafish per condition. (D) Relative expression of the hepatic gluconeogenic enzymes glucose 6-phosphatase (G6Pase) and phosphoenolpyruvate carboxykinase (PEPCK) in BRAF/p53 fish normalized to WT expression. Values are mean ± SEM; n = 4–5 zebrafish per group. (E–H) Fractional labeling, relative to serum M6 glucose, of isotopologues for glucose (E), lactate (F), alanine (G), and pyruvate (H) in serum and liver of WT and BRAF/p53 animals. Data are presented as fold changes relative to the WT group. Values are mean ± SEM; n = 5–10 zebrafish per condition. Full labeling data are provided in Data S3. (I) Fractional labeling, relative to serum M6 glucose, of alanine in tissues from BRAF/p53 animals. Data are presented as fold changes relative to alanine labeling in tumors. Values are mean ± SEM; n = 10 zebrafish per condition. (J) Alanine uptake in tissues from BRAF/p53 zebrafish. Pool sizes of 2-aminoisobutyric acid (2-AIB) for tissues within a fish are normalized to the 2-AIB pool in its tumor. Values are mean ± SEM; n = 5 zebrafish per condition. Statistically significant differences were assessed by a two-tailed paired t test and annotated as follows: ∗p < 0.05, ∗∗p < 0.01, or n.s. = not significant. |
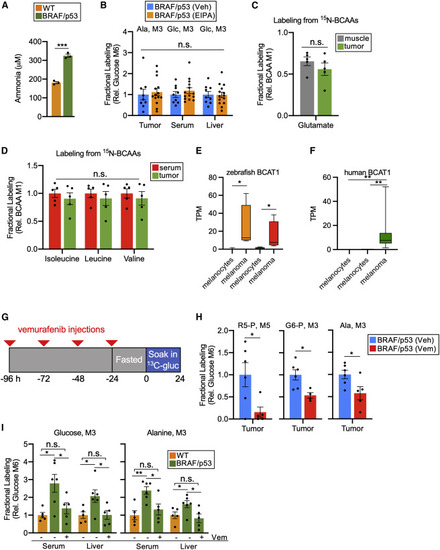
Circulating BCAAs provide melanoma with a source of nitrogen for the alanine cycle, which can be impaired by vemurafenib (A) Concentration of ammonia excreted into tank water from WT and BRAF/p53 fish. Measurements were made 24 h after water refreshing. Each group was housed separately. Values are mean ± SEM; n = 3 zebrafish per condition. (B) Fractional labeling, relative to M6 glucose, of M3 alanine and M3 glucose in BRAF/p53 zebrafish treated with EIPA or DMSO (Veh). Values are mean ± SEM; n = 9–14 zebrafish per condition. (C) Fractional labeling, relative to serum M1 BCAAs, of glutamate in tumor and muscle of BRAF/p53 fish. Serum M1 BCAAs was determined by averaging the values of M1 from isoleucine, leucine, and valine. Data are available in Data S4. Values are mean ± SEM; n = 5 zebrafish. (D) Fractional labeling, relative to serum M1 BCAAs, of isoleucine, leucine, and valine in serum and tumor of BRAF/p53 fish. Data are available in Data S4. Values are mean ± SEM; n = 5 zebrafish per condition. (E) BCAT1 expression in zebrafish melanocytes and BRAF/p53 melanoma cells. Our data are on the left, and data from Venkatesan et al. are on the right. Center line, median; box limits are first and third quartile; whiskers, range. (F) BCAT1 expression in human melanocytes and human melanoma. Data on left are from Haltaufderhyde et al., data in center are from Reeman et al., and our data are on right. (G) Schematic of when vemurafenib and [U-13C] glucose were administered to melanoma-bearing zebrafish. Red triangles denote the timing of vemurafenib injections. (H) Fractional labeling, relative to serum M6 glucose, of the central carbon intermediates ribose 5-phosphate (left), glucose 6-phosphate (middle), and alanine (right) in tumors treated with either DMSO (Veh) or vemurafenib (Vem). Data are normalized to the vehicle-treated group. Full labeling data are provided in Data S4. Values are mean ± SEM; n = 4–6 zebrafish per condition. (I) Fractional labeling, relative to serum M6 glucose, of gluconeogenesis-derived glucose (left) and alanine (right) in circulation and liver of vehicle-treated WT, vehicle-treated BRAF/p53, and vemurafenib-treated BRAF/p53 fish. Data are normalized to the vehicle-treated WT group. Values are mean ± SEM; n = 5–6 zebrafish per condition. Full labeling data are provided in Data S4. Statistically significant differences were assessed by a two-tailed paired t test (A–D, H, and I) or a Wilcoxon rank-sum test (E and F) and annotated as follows: ∗p < 0.05, ∗∗p < 0.01, ∗∗∗p < 0.001, or n.s. = not significant. R5-P, ribose 5-phosphate; G6-P, glucose 6-phosphate; Ala, alanine; Glc, glucose. |
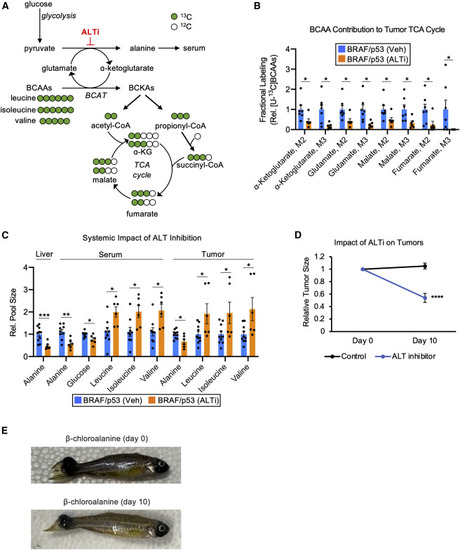
Pharmacologically inhibiting ALT provides direct support for tumor-liver alanine cycling (A) Schematic to illustrate the transformation of BCAA carbon to key intermediates in central carbon metabolism. (B) Fractional labeling, relative to serum [U-13C] BCAAs, of the central carbon intermediates α-ketoglutarate, glutamate, malate, and fumarate in tumors treated with either vehicle (Veh) or β-chloroalanine (ALTi). Data are normalized to the vehicle-treated group. Serum [U-13C] BCAAs was determined by averaging [U-13C] isoleucine, [U-13C] leucine, and [U-13C] valine. Values are mean ± SEM; n = 6–7 zebrafish per condition. Full labeling data are available in Data S5. (C) Relative pool sizes of central carbon metabolites from BRAF/p53 animals treated with either vehicle (Veh) or β-chloroalanine (ALTi). Data are normalized to the vehicle-treated group. Values are mean ± SEM; n = 6–10 zebrafish per condition. Data are available in Data S5. (D) Relative change from baseline in tumor volume after 10 days of β-chloroalanine (ALT inhibitor) treatment. Values are mean ± SEM; n = 9–10 tumors per condition. Tumor dimensions are included Data S5. (E) Representative image of tumor regression in a BRAF/p53 fish after 10 days of β-chloroalanine treatment. Statistically significant differences were assessed by a two-tailed paired t test and annotated as follows: ∗p < 0.05, ∗∗p < 0.01, ∗∗∗p < 0.001, ∗∗∗∗p < 0.0001, or n.s. = not significant. |
Reprinted from Cell Metabolism, 33(7), Naser, F.J., Jackstadt, M.M., Fowle-Grider, R., Spalding, J.L., Cho, K., Stancliffe, E., Doonan, S.R., Kramer, E.T., Yao, L., Krasnick, B., Ding, L., Fields, R.C., Kaufman, C.K., Shriver, L.P., Johnson, S.L., Patti, G.J., Isotope tracing in adult zebrafish reveals alanine cycling between melanoma and liver, 1493-1504.e5, Copyright (2021) with permission from Elsevier. Full text @ Cell Metab.