
Fig. 2
- ID
- ZDB-IMAGE-220224-21
- Publication
- Naser et al., 2021 - Isotope tracing in adult zebrafish reveals alanine cycling between melanoma and liver
- All Figures
- Figures for Naser et al., 2021
|
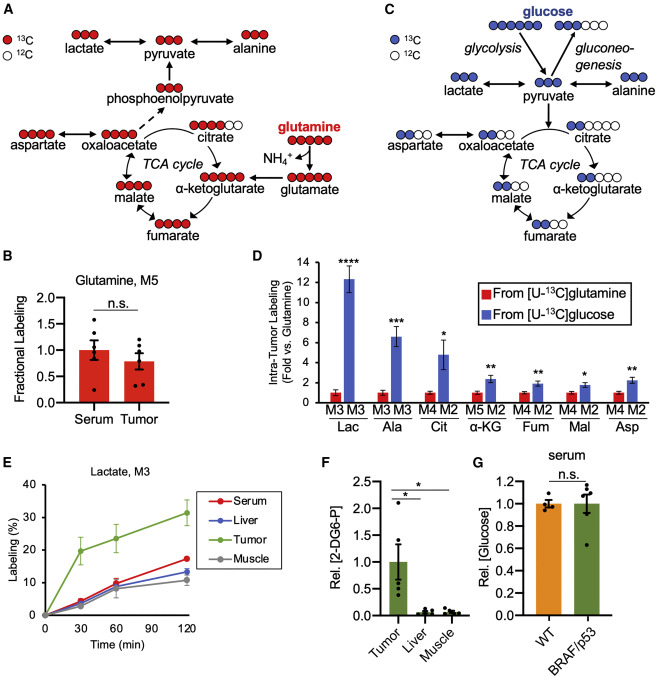
Fig. 2 Glucose is a major carbon source for melanoma metabolism in vivo (A) Schematic to illustrate the transformation of glutamine carbon to key intermediates in central carbon metabolism. (B) Fractional labeling in tumor M5 glutamine, normalized to serum M5 glutamine, from a [U-13C] glutamine tracer. Values are mean ± SEM; n = 6 zebrafish. (C) Schematic to illustrate the transformation of glucose carbon to key intermediates in central carbon metabolism. (D) Comparison of the 13C-contribution from glucose and glutamine tracers to central carbon metabolites in melanoma. As expected, the isotopologues shown accounted for the majority of the labeling. Data shown here are presented as fold changes (i.e., the amount of labeling from [U-13C] glucose relative to the amount of labeling from [U-13C] glutamine, which is normalized to 1). Values are mean ± SEM; n = 6–10 zebrafish per condition. (E) Absolute enrichment of lactate (M3 isotopologue) over time in tissues from BRAF/p53 zebrafish following an intraperitoneal injection of [U-13C] glucose. Data are mean ± SEM; n = 3–4 zebrafish per time point. (F) Glucose uptake in tissues from BRAF/p53 zebrafish. Relative concentration of 2-deoxyglucose 6-phosphate (2-DG6-P) for tissues within a fish are normalized to the 2-DG6-P pool in its tumor. Values are mean ± SEM; n = 5–6 zebrafish per condition. (G) Relative pool size of circulating glucose in WT and BRAF/p53 fish, normalized to the WT group. Values are mean ± SEM; n = 4–6 zebrafish per condition. Statistically significant differences were assessed by a two-tailed paired t test and annotated as follows: ∗p < 0.05, ∗∗p < 0.01, ∗∗∗p < 0.001, ∗∗∗∗p < 0.0001, or n.s. = not significant. Lac, lactate; Ala, alanine; Cit, citrate; α-KG, α-ketoglutarate; Fum, fumarate; Mal, malate; Asp, aspartate. Full labeling data are provided in Data S2.
Reprinted from Cell Metabolism, 33(7), Naser, F.J., Jackstadt, M.M., Fowle-Grider, R., Spalding, J.L., Cho, K., Stancliffe, E., Doonan, S.R., Kramer, E.T., Yao, L., Krasnick, B., Ding, L., Fields, R.C., Kaufman, C.K., Shriver, L.P., Johnson, S.L., Patti, G.J., Isotope tracing in adult zebrafish reveals alanine cycling between melanoma and liver, 1493-1504.e5, Copyright (2021) with permission from Elsevier. Full text @ Cell Metab.