
Fig. 3
- ID
- ZDB-IMAGE-220224-22
- Publication
- Naser et al., 2021 - Isotope tracing in adult zebrafish reveals alanine cycling between melanoma and liver
- All Figures
- Figures for Naser et al., 2021
|
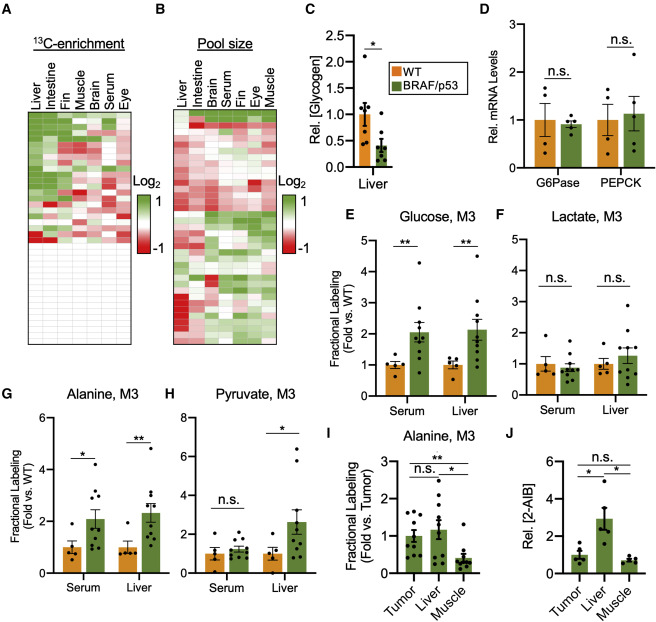
Fig. 3 Systems-level isotope tracing reveals elevated hepatic gluconeogenesis in BRAF/p53 fish, fueled by melanoma-derived alanine (A) Heatmap of normalized labeling differences in various metabolites from [U-13C] glucose. Differences were calculated by comparing the normalized labeling of a tissue from BRAF/p53 fish with the normalized labeling of the same tissue from WT fish. Green indicates increased labeling and red indicates decreased labeling in metabolites from BRAF/p53 fish. Each data point represents the ratio of means from biological replicates. White boxes denote metabolites that did not incorporate 13C tracer. n = 5–10 zebrafish per condition. The identities of each metabolite within the plot and full labeling data are available in Data S3. (B) Heatmap of metabolite pool-size differences in tissues from BRAF/p53 fish relative to tissues from WT fish. Green indicates larger pool size, and red indicates smaller pool size of metabolites from BRAF/p53 fish. Each data point represents the ratio of means from biological replicates. n = 5–10 zebrafish per condition. The identities of each metabolite within the plot and pool-size data are available in Data S3. (C) Relative concentration of hepatic glycogen in WT and BRAF/p53 fish, normalized to the WT group. Values are mean ± SEM; n = 7 zebrafish per condition. (D) Relative expression of the hepatic gluconeogenic enzymes glucose 6-phosphatase (G6Pase) and phosphoenolpyruvate carboxykinase (PEPCK) in BRAF/p53 fish normalized to WT expression. Values are mean ± SEM; n = 4–5 zebrafish per group. (E–H) Fractional labeling, relative to serum M6 glucose, of isotopologues for glucose (E), lactate (F), alanine (G), and pyruvate (H) in serum and liver of WT and BRAF/p53 animals. Data are presented as fold changes relative to the WT group. Values are mean ± SEM; n = 5–10 zebrafish per condition. Full labeling data are provided in Data S3. (I) Fractional labeling, relative to serum M6 glucose, of alanine in tissues from BRAF/p53 animals. Data are presented as fold changes relative to alanine labeling in tumors. Values are mean ± SEM; n = 10 zebrafish per condition. (J) Alanine uptake in tissues from BRAF/p53 zebrafish. Pool sizes of 2-aminoisobutyric acid (2-AIB) for tissues within a fish are normalized to the 2-AIB pool in its tumor. Values are mean ± SEM; n = 5 zebrafish per condition. Statistically significant differences were assessed by a two-tailed paired t test and annotated as follows: ∗p < 0.05, ∗∗p < 0.01, or n.s. = not significant.
Reprinted from Cell Metabolism, 33(7), Naser, F.J., Jackstadt, M.M., Fowle-Grider, R., Spalding, J.L., Cho, K., Stancliffe, E., Doonan, S.R., Kramer, E.T., Yao, L., Krasnick, B., Ding, L., Fields, R.C., Kaufman, C.K., Shriver, L.P., Johnson, S.L., Patti, G.J., Isotope tracing in adult zebrafish reveals alanine cycling between melanoma and liver, 1493-1504.e5, Copyright (2021) with permission from Elsevier. Full text @ Cell Metab.