FIGURE SUMMARY
Title

Hoxd13/Bmp2-mediated mechanism involved in zebrafish finfold design

Authors
Castro, J., Beviano, V., Paço, A., Leitão-Castro, J., Cadete, F., Francisco, M., Freitas, R.
Source
Full text @ Sci. Rep.

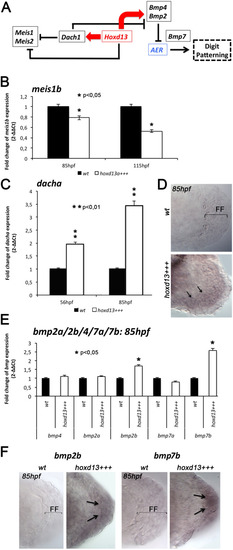
Expression levels of hoxd13a putative targets in hoxd13a-overexpressing fins (hoxd13+++) and controls (Wt) analyzed by RT-qPCR (B,C,E) and ISH (D,F,G). (A) Central role of the transcription factor Hoxd13 in the distal patterning of tetrapod limbs, based in Salsi and colleagues6. (B)meis1b appears downregulation in hoxd13+++ fins in comparison with Wt at 85 and 115 hpf. (C,D)dachA presents higher expression in hoxd13+++ fins than in Wt controls at 56 and 85 hpf (C) and is ectopically expressed in the distal margin of the transgenic fins at 85hpf (arrows), under the remaining finfold (FF) (D). (E,F) Expression analyses of bmp2a, bmp2b, bmp4, bmp7a, and bmp7b reveal upregulation of bmp2b and bmp7b in hoxd13+++ fins (E), which are ectopically expressed in the remaining finfold. Statistical significance evaluated by unpaired t-test: *p < 0.05; **p < 0.01.

Anti-phospho-smad1/5 immunostaining (Psmad1/5) at 86hpf in wild-type (A) hoxd13a-overexpressing fins (B). Note intense positive staining in the remaining finfold (FF) of the hoxd13a-overexpressing fins (hoxd13+++), which is not detectable in the wild-type condition (Wt).

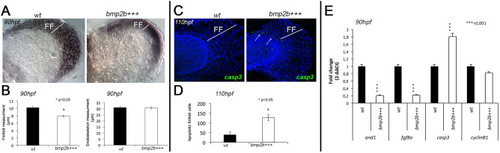
Phenotype and gene expression during fin development in bmp2b-overexpressing fins (bmp2b+++) and controls (Wt). (A) ISH for and1 highlights the shorter finfolds (FF) of bmp2b+++ fins in comparison with controls, similar to hoxd13+++ fins. (B) Finfold and endoskeleton measurements, after and1 ISH, revel significant reduction of the finfold in bmp2b+++ fins (n = 50; *p < 0.05). (C,D) Imunnostaining with anti-casp3 antibody (C) and subsequent counting of the casp3-positive cells in the finfold (n = 9; *p < 0.05) (D) suggests higher apoptotic activity in bmp2b+++ finfolds than in Wt controls at stage 110 hpf. (E) RT-qPCR analyses to evaluate gene expression in bmp2b+++ fins and Wt controls at 90 hpf indicate upregulation of casp3 (***p < 0.001), downregulation of finfold markers and1 and fgf8a (***p < 0.01) and non-significant alteration of ccnb1, involved in cell proliferation. Statistical significance evaluated by unpaired t-test.

Finfold growth and gene expression in leot1/lofdt2 mutants and controls (Wt). (A) Fin phenotype comparisons in adults. (B,C) Finfold size comparison during development evaluated after and1 ISH (B), followed by measurements (C), revealing a longer finfold detectable since 48hpf in leot1/lofdt2 mutants, in comparison with controls (n = 20, *p < 0.05). (D) Gene expression analyses by RT-qPCR at 86hpf, suggest lower expression levels for hoxd13a and bmp2b in leot1/lofdt2 fins in comparison with Wt controls (***p < 0.001) detected by RT-qPCR (on the right) and ISH (on the left), which was accompanied by decreased expression of casp3, involved in apoptosis (**p < 0.01) and ccnb1, involved in proliferation (***p < 0.001). Statistical significance evaluated by unpaired t-test.

Acknowledgments
This image is the copyrighted work of the attributed author or publisher, and ZFIN has permission only to display this image to its users. Additional permissions should be obtained from the applicable author or publisher of the image. Full text @ Sci. Rep.