IMAGE

Figure 4

ID
ZDB-IMAGE-210403-26
Source
Figures for Castro et al., 2021
Image
Figure Caption

Figure 4

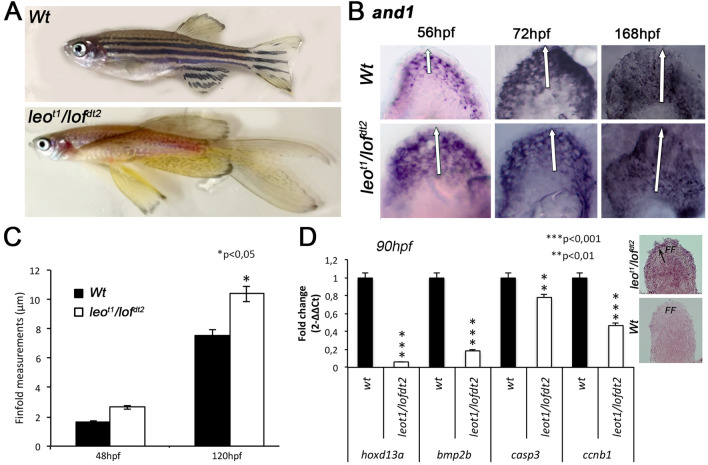
Finfold growth and gene expression in leot1/lofdt2 mutants and controls (Wt). (A) Fin phenotype comparisons in adults. (B,C) Finfold size comparison during development evaluated after and1 ISH (B), followed by measurements (C), revealing a longer finfold detectable since 48hpf in leot1/lofdt2 mutants, in comparison with controls (n = 20, *p < 0.05). (D) Gene expression analyses by RT-qPCR at 86hpf, suggest lower expression levels for hoxd13a and bmp2b in leot1/lofdt2 fins in comparison with Wt controls (***p < 0.001) detected by RT-qPCR (on the right) and ISH (on the left), which was accompanied by decreased expression of casp3, involved in apoptosis (**p < 0.01) and ccnb1, involved in proliferation (***p < 0.001). Statistical significance evaluated by unpaired t-test.

Acknowledgments
This image is the copyrighted work of the attributed author or publisher, and ZFIN has permission only to display this image to its users. Additional permissions should be obtained from the applicable author or publisher of the image. Full text @ Sci. Rep.