
- Title
-
The insecticide permethrin induces transgenerational behavioral changes linked to transcriptomic and epigenetic alterations in zebrafish (Danio rerio)
- Authors
- Blanc, M., Antczak, P., Cousin, X., Grunau, C., Scherbak, N., Rüegg, J., Keiter, S.H.
- Source
- Full text @ Sci. Total Environ.

PC1 (A) and PC2 (B) individual loadings after novel tank diving test in F0, F1, and F2 generations of adult male fish. #: p < 0.1; *: p < 0.05. PL: 1 μg/L Permethrin; PH: 10 μg/L Permethrin; SC: Solvent Control (DMSO 0.01%). Numeric values are available in Table S8. |
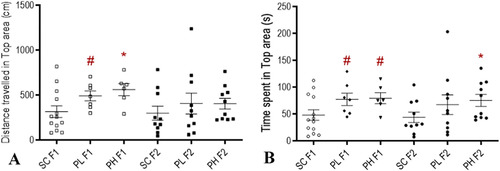
Univariate analysis related to anxiety-like behavior in males of the F1 and F2 generations. A: Distance travelled in top area; B: Time spent in Top area. #: p < 0.1; *: p < 0.05. PL: 1 μg/L Permethrin; PH: 10 μg/L Permethrin; SC: Solvent Control (DMSO 0.01%). Numeric values are available in Table S8. |
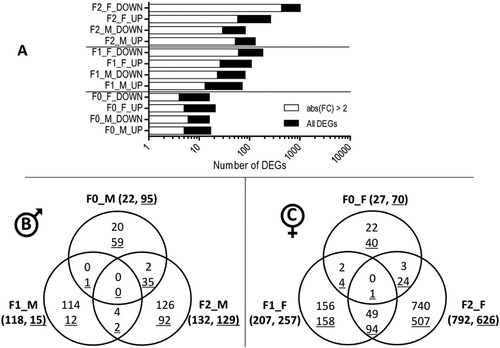
A. Distribution of differentially expressed genes (DEGs) between upregulation (UP) and downregulation (DOWN) in F0 males (F0_M), F0 females (F0_F), F1 males (F1_M), F1 females (F1_F), F2 males (F2_M) and F2 females (F2_F) following F0 early exposure to permethrin 10 μg/L (n = 4). The graphic displays the total number of DEGs as well as the proportion of transcripts showing an absolute fold change above 2. B. Venn diagram showing the number of differentially expressed genes and overlapping between the 3 generations of males (padj≤0.05). Underlined numbers show significantly enriched gene sets according to Gene Set Enrichment Analysis (GSEA) results (padj≤0.05). C. Venn diagram showing the number of differentially expressed genes and overlapping between the 3 generations of females (padj≤0.05). Underlined numbers show significantly enriched gene sets according to Gene Set Enrichment Analysis (GSEA) results (padj≤0.05). |
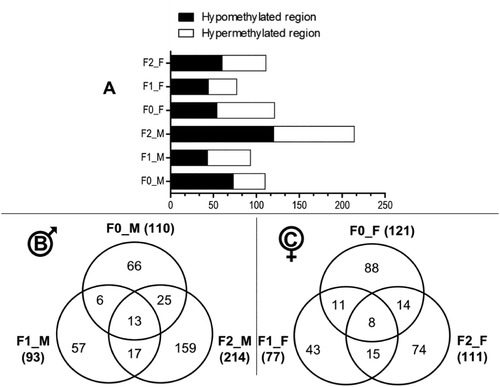
Changes in DNA methylation in F0, F1 and F2 generations of zebrafish following F0 early-life exposure to permethrin 10 μg/L (n = 4; except for treated F0 males where n = 3). A. Distribution of the Differentially Methylated Regions (DMRs) between hypo- and hypermethylation within each dataset (padj≤0.05): F0 males (F0_M), F0 females (F0_F), F1 males (F1_M), F1 females (F1_F), F2 males (F2_M) and F2 females (F2_F). B. Venn diagram showing the number of DMRs and overlaps between the 3 generations in males (padj≤0.05). C. Venn diagram showing the number of DMRs and overlaps between the 3 generations in females (padj≤0.05). |
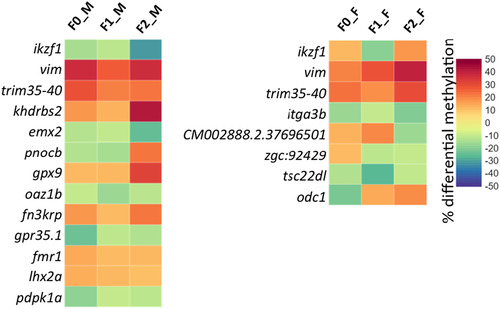
Heatmap showing inherited differentially methylated regions (padj≤0.05) in F0, F1, and F2 generations of males (left) or females (right) (n = 4; except for treated F0 males where n = 3). Row headings refer to genes associated to DMRs. If none, it refers to the DMR as chromosome name.starting position. Column headings refer to F0 males (F0_M), F0 females (F0_F), F1 males (F1_M), F1 females (F1_F), F2 males (F2_M) and F2 females (F2_F). Numeric values are available in Table S6 and Excel Tables S9–S14. |