
|
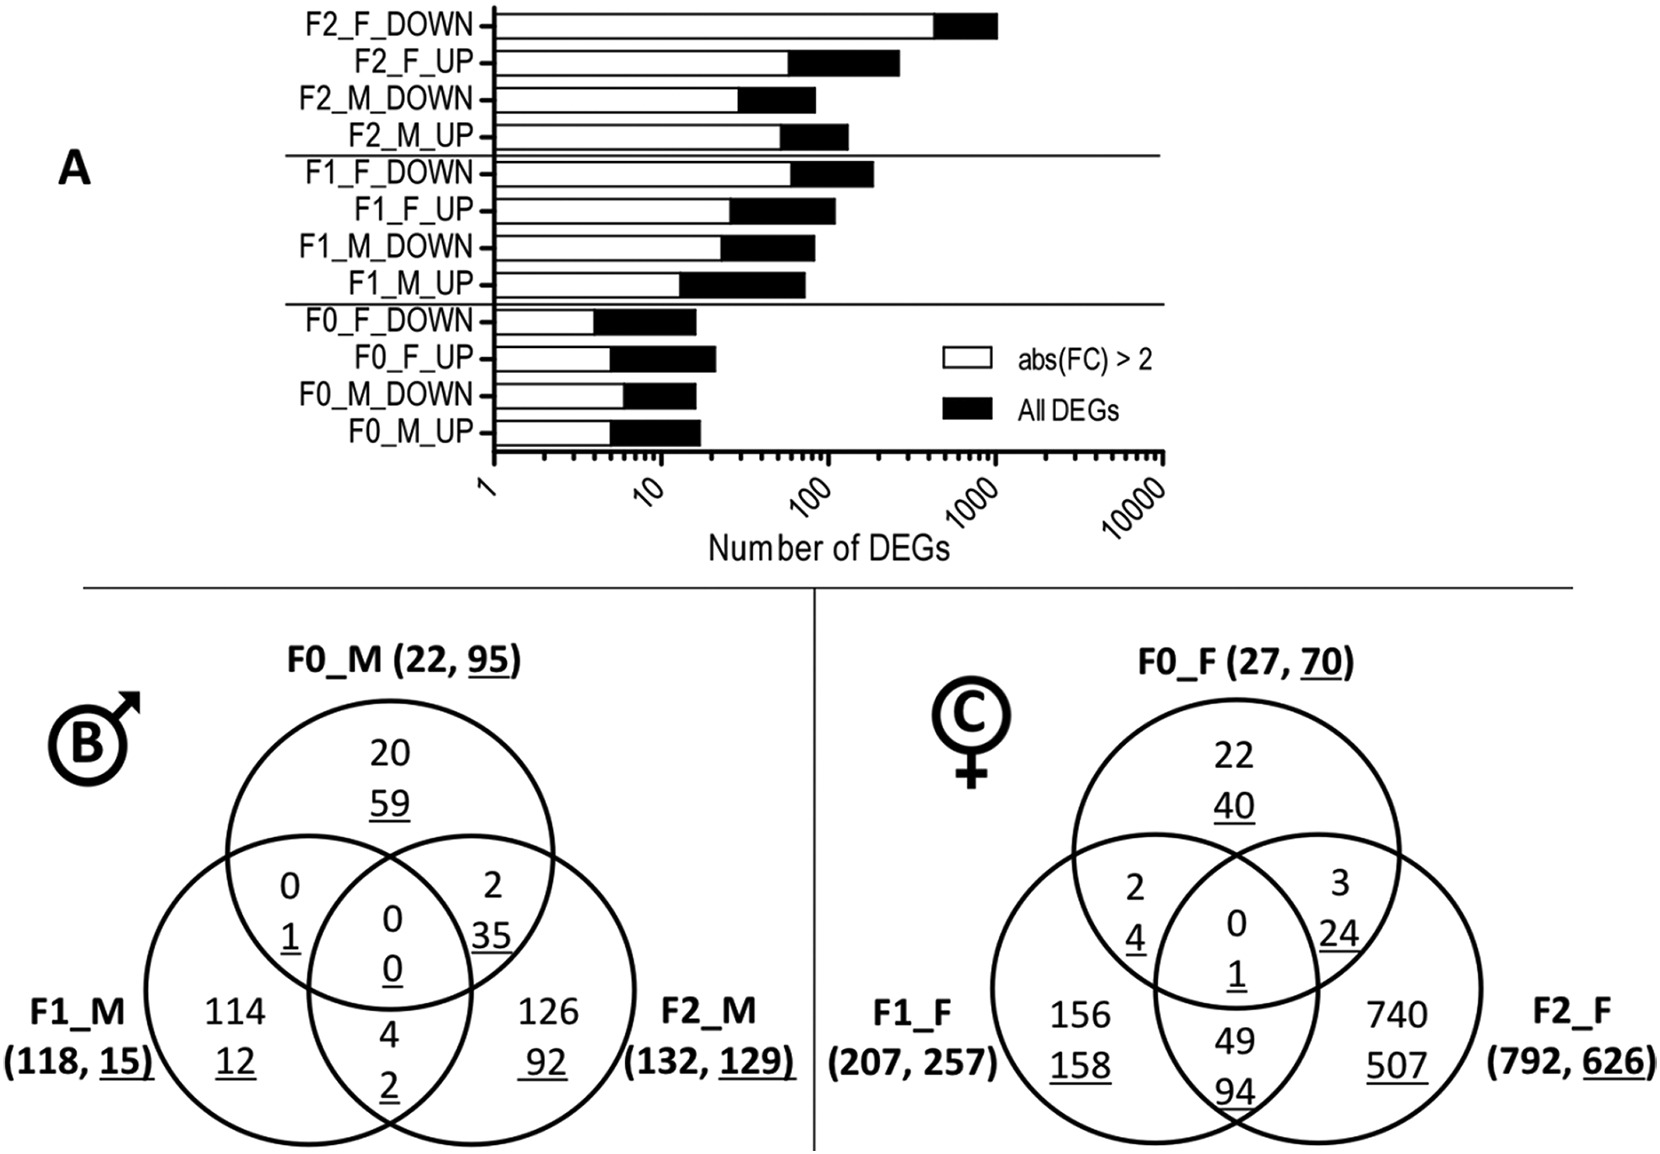
Fig. 3 A. Distribution of differentially expressed genes (DEGs) between upregulation (UP) and downregulation (DOWN) in F0 males (F0_M), F0 females (F0_F), F1 males (F1_M), F1 females (F1_F), F2 males (F2_M) and F2 females (F2_F) following F0 early exposure to permethrin 10 μg/L (n = 4). The graphic displays the total number of DEGs as well as the proportion of transcripts showing an absolute fold change above 2. B. Venn diagram showing the number of differentially expressed genes and overlapping between the 3 generations of males (padj≤0.05). Underlined numbers show significantly enriched gene sets according to Gene Set Enrichment Analysis (GSEA) results (padj≤0.05). C. Venn diagram showing the number of differentially expressed genes and overlapping between the 3 generations of females (padj≤0.05). Underlined numbers show significantly enriched gene sets according to Gene Set Enrichment Analysis (GSEA) results (padj≤0.05).