
|
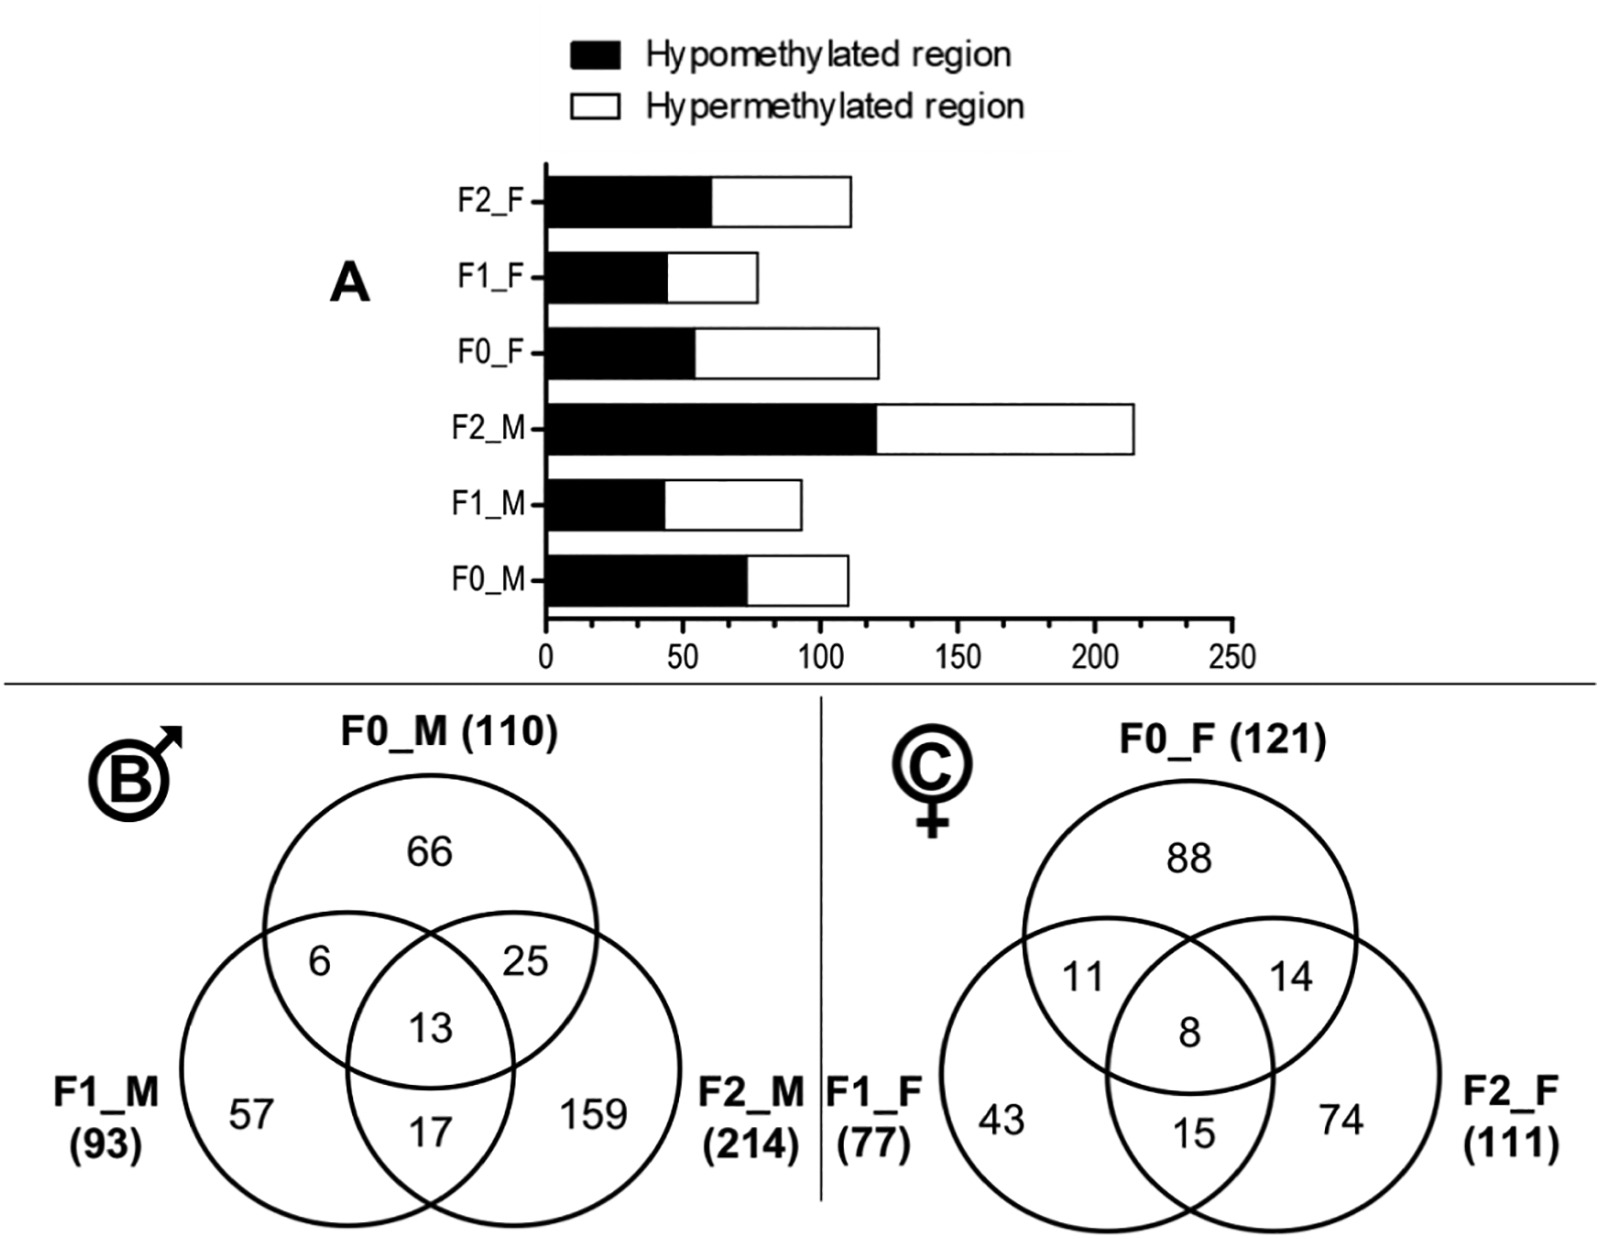
Fig. 4 Changes in DNA methylation in F0, F1 and F2 generations of zebrafish following F0 early-life exposure to permethrin 10 μg/L (n = 4; except for treated F0 males where n = 3). A. Distribution of the Differentially Methylated Regions (DMRs) between hypo- and hypermethylation within each dataset (padj≤0.05): F0 males (F0_M), F0 females (F0_F), F1 males (F1_M), F1 females (F1_F), F2 males (F2_M) and F2 females (F2_F). B. Venn diagram showing the number of DMRs and overlaps between the 3 generations in males (padj≤0.05). C. Venn diagram showing the number of DMRs and overlaps between the 3 generations in females (padj≤0.05).