
- Title
-
Interaction between probiotic additive and perfluorobutanesulfonate pollutant on offspring growth and health after parental exposure using zebrafish
- Authors
- Liu, M., Tang, L., Hu, C., Sun, B., Huang, Z., Chen, L.
- Source
- Full text @ Ecotoxicol. Environ. Saf.
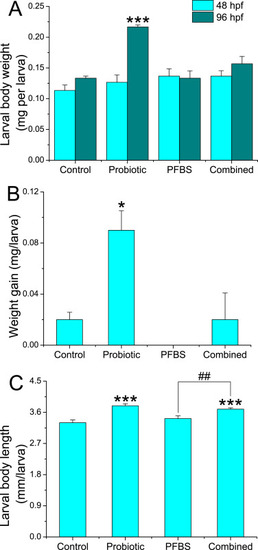
Alterations in larval growth of zebrafish offspring after parental exposure to PFBS (0 and 10 μg/L) with or without dietary administration of probiotic Lactobacillus rhamnosus. (A) Larval body weight; (B) Larval weight gain; (C) Larval body length. Values are presented as mean ± SEM of replicates. *P < 0.05 and *** P < 0.001 indicate significant difference between the exposure groups (PFBS or/and probiotic) and the control group; ##P < 0.01 indicates significant difference between the coexposure group (PFBS and probiotic) and the corresponding PFBS alone group. |

Brief summary of differential proteins in larval offspring after parental exposure to PFBS (0 and 10 μg/L) with or without dietary administration of probiotic Lactobacillus rhamnosus. (A) Number of differential proteins of significantly increased or decreased expression in each group; (B) A Venn diagram showing the common or unique proteins among exposure groups; (C) A heatmap showing the overall changes of differential proteins among exposure groups; (D) Principal component analysis (PCA) with the input of differential proteins based on the variance-covariance matrix. In the heatmap, red and green colors stand for increased and decreased changes, respectively, relative to the control abundances. Color intensity is proportional to the changing magnitude. Values are presented as means of three replicates (n = 3). (For interpretation of the references to colour in this figure legend, the reader is referred to the web version of this article.) |

KEGG pathways of significant enrichment in offspring larvae after parental exposure to PFBS (0 and 10 μg/L) with or without dietary administration of probiotic Lactobacillus rhamnosus. Color intensity is proportional to the degree of enrichment significance (P-value). Circular area represents the value of rich factor (%). |

Differential proteome profile in the combined group relative to the PFBS single exposure group. (A) Number of differential proteins of significantly up- or down-regulated expression in the combined group; (B) GO annotation of the differential proteins in the combined exposure group; (C) KEGG pathways of significant enrichment in the combined group. The y axis indicates the degree of enrichment significance (-log10(Padj)). Circular area represents the value of rich factor (%). |
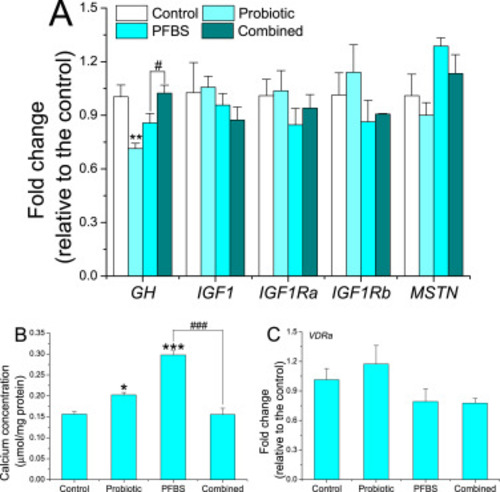
Molecular alterations in larval offspring viability after parental exposure to PFBS (0 and 10 μg/L) with or without dietary administration of probiotic Lactobacillus rhamnosus. (A) Gene transcriptions along GH/IGF axis; (B) Calcium concentration; (C) VDRa gene transcription. Values are presented as mean ± SEM of three replicates (n = 3). *P < 0.05, ** P < 0.01 and *** P < 0.001 indicate significant difference between the exposure groups (PFBS or/and probiotic) and the control group; #P < 0.05 and ###P < 0.001 indicate significant difference between the coexposure group (PFBS and probiotic) and the corresponding PFBS alone group. |
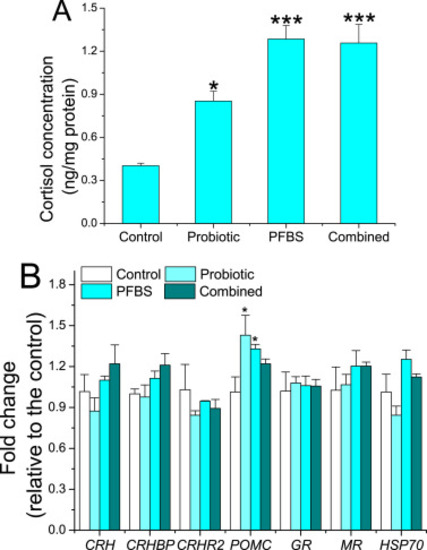
Alterations in HPA axis of larval offspring after parental exposure to PFBS (0 and 10 μg/L) with or without dietary administration of probiotic Lactobacillus rhamnosus. (A) Cortisol hormone concentration; (B) Gene transcriptions along HPA axis. Values are presented as mean ± SEM of three replicates (n = 3). *P < 0.05 and *** P < 0.001 indicate significant difference between the exposure groups (PFBS or/and probiotic) and the control group. |
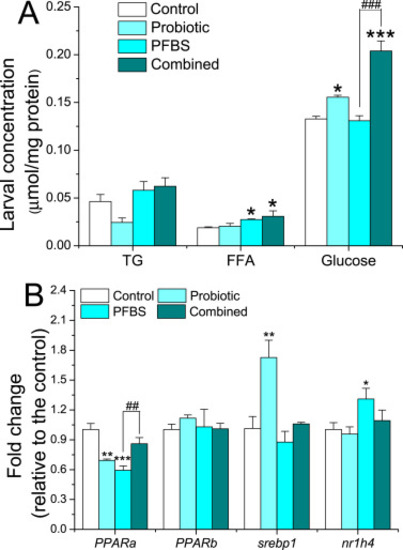
Alterations in nutrient metabolism of larval offspring after parental exposure to PFBS (0 and 10 μg/L) with or without dietary administration of probiotic Lactobacillus rhamnosus. (A) TG, FFA and glucose concentrations; (B) Transcriptions of lipid nuclear receptor genes. Values are presented as mean ± SEM of three replicates (n = 3). *P < 0.05, ** P < 0.01 and *** P < 0.001 indicate significant difference between the exposure groups (PFBS or/and probiotic) and the control group; ##P < 0.01 and ###P < 0.001 indicate significant difference between the coexposure group (PFBS and probiotic) and the corresponding PFBS alone group. |