
|
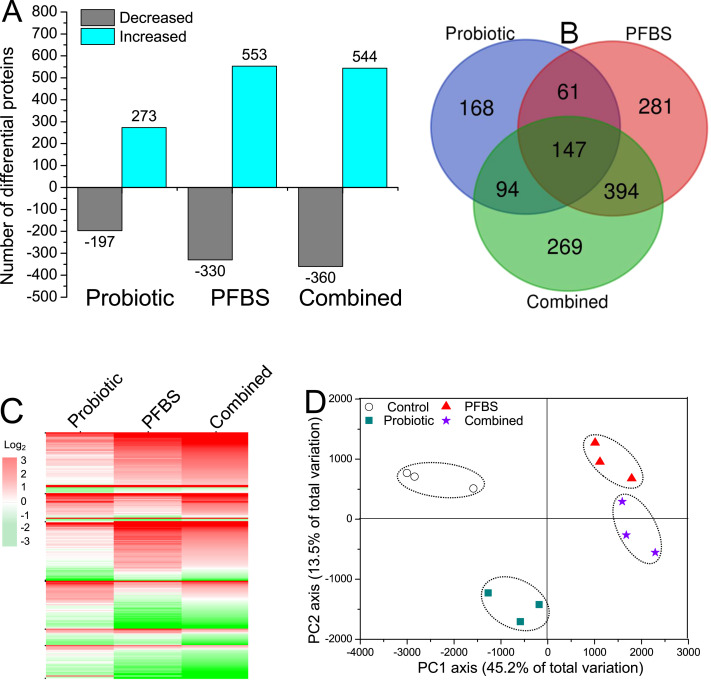
Fig. 2 Brief summary of differential proteins in larval offspring after parental exposure to PFBS (0 and 10 μg/L) with or without dietary administration of probiotic Lactobacillus rhamnosus. (A) Number of differential proteins of significantly increased or decreased expression in each group; (B) A Venn diagram showing the common or unique proteins among exposure groups; (C) A heatmap showing the overall changes of differential proteins among exposure groups; (D) Principal component analysis (PCA) with the input of differential proteins based on the variance-covariance matrix. In the heatmap, red and green colors stand for increased and decreased changes, respectively, relative to the control abundances. Color intensity is proportional to the changing magnitude. Values are presented as means of three replicates (n = 3). (For interpretation of the references to colour in this figure legend, the reader is referred to the web version of this article.)