
- Title
-
Roots and stems of Kadsura coccinea extract induced developmental toxicity in zebrafish embryos/larvae through apoptosis and oxidative stress
- Authors
- Xia, Z., Hao, E., Chen, Z., Zhang, M., Wei, Y., Wei, M., Hou, X., Du, Z., Deng, J.
- Source
- Full text @ Pharm Biol
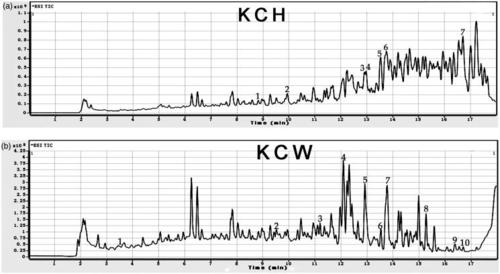
Component analysis of KCH and KCW. (a, b) The total ion current chromatograms of KCH and KCW. |
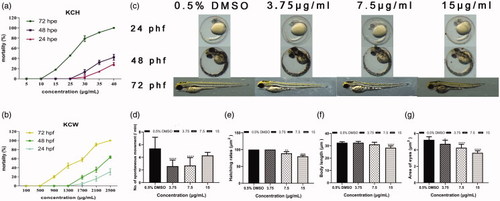
Effects of KCH and KCW on legality curves and morphological analyses of the embryos. (a) The legality curves of KCH on zebrafish embryos at 24, 48 and 72 hpf. (b) The legality curves of KCW on zebrafish embryos at 24, 48 and 72 hpf. (c) Effects of KCH on morphological analyses of the embryos at 24, 48 and 72 hpf. (d) The embryo spontaneous movement in the KCH group at 24 hpf. (e) The hatching rates of KCH-treated larvae at 72 hpf. (f) The body length of KCH-treated larvae at 72 hpf. (g) The eye area of KCH-treated larvae at 72 hpf. * |
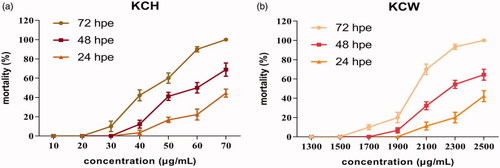
Effects of KCH and KCW on larval toxicity at 24, 48 and 72 hpe. (a) Mortality concentration of KCH. (b) Mortality concentration of KCW. |
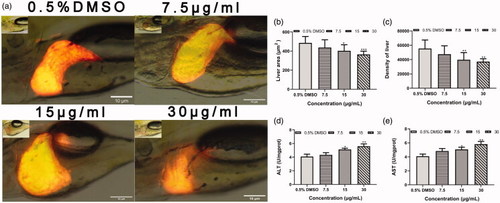
Effects of KCH on the hepatotoxicity in larvae at 72 hpe. (a) Liver morphology of KCH-treated larvae. (b) Liver areas of KCH-treated larvae. (c) Liver fluorescence intensity of KCH-treated larvae. (d) AST levels of KCH-treated larvae. (e) ALT levels of KCH-treated larvae. * |

Effects of ROS generation, apoptotic cells, T-SOD activities and MDA contents in KCH treatment groups at 72 hpe. (a) ROS fluorescence staining in larvae treated with KCH. (b) ROS fluorescence levels in larvae treated with KCH. (c) Apoptosis of the larvae treated with KCH. Red arrow represents apoptotic cells. (d) The fluorescence intensity of apoptosis in the larvae treated with KCH. (e) The T-SOD activities in larvae treated with KCH. (f) The MDA levels in larvae treated with KCH. * |
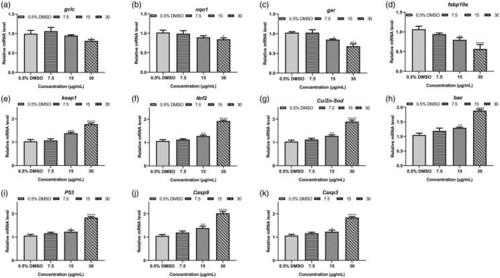
The mRNA expression levels of genes in larvae treated with KCH at 72 hpe. The mRNA expression levels of hepatotoxicity marker genes |