
Image
|
Figure Caption
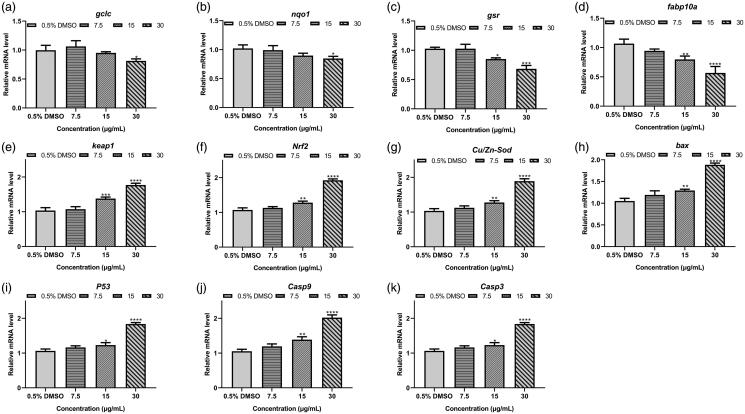
Figure 6.
The mRNA expression levels of genes in larvae treated with KCH at 72 hpe. The mRNA expression levels of hepatotoxicity marker genes
Acknowledgments
This image is the copyrighted work of the attributed author or publisher, and
ZFIN has permission only to display this image to its users.
Additional permissions should be obtained from the applicable author or publisher of the image.
Full text @ Pharm Biol