
Image
|
Figure Caption
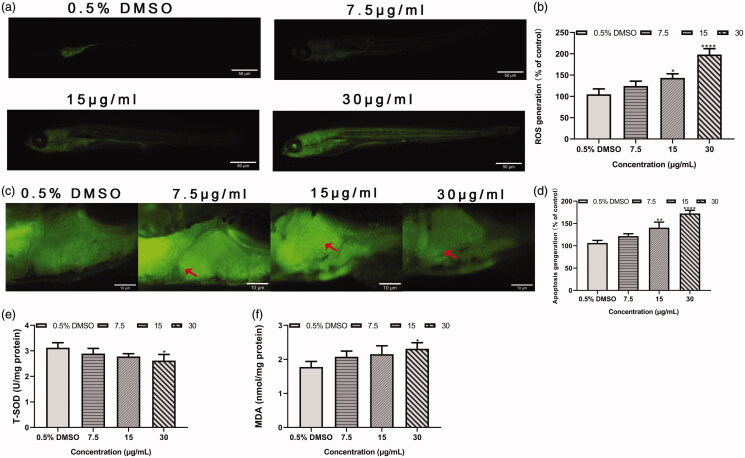
Figure 5.
Effects of ROS generation, apoptotic cells, T-SOD activities and MDA contents in KCH treatment groups at 72 hpe. (a) ROS fluorescence staining in larvae treated with KCH. (b) ROS fluorescence levels in larvae treated with KCH. (c) Apoptosis of the larvae treated with KCH. Red arrow represents apoptotic cells. (d) The fluorescence intensity of apoptosis in the larvae treated with KCH. (e) The T-SOD activities in larvae treated with KCH. (f) The MDA levels in larvae treated with KCH. *
Acknowledgments
This image is the copyrighted work of the attributed author or publisher, and
ZFIN has permission only to display this image to its users.
Additional permissions should be obtained from the applicable author or publisher of the image.
Full text @ Pharm Biol