
- Title
-
A new reporter zebrafish line unveils heterogeneity among lymphatic endothelial cells during development
- Authors
- Frétaud, M., Do Khoa, N., Houel, A., Lunazzi, A., Boudinot, P., Langevin, C.
- Source
- Full text @ Dev. Dyn.

The Tg(batf3MIN:eGFP) line expresses eGFP under the control of the promoter of the unique zebrafish ortholog of the transcription factor batf3. A, Phylogenetic tree (NJ, 100 bootstraps) of batf sequences from human, zebrafish, Atlantic salmon, and rainbow trout. B, Schematic representation of the transgene of the Tg(batf3MIN:eGFP) zebrafish line |
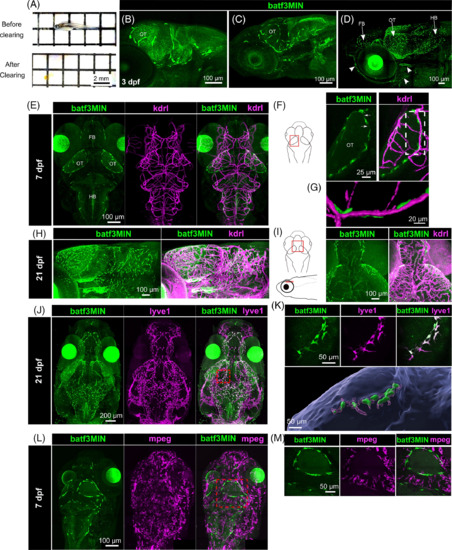
Cranial and facial lymphatics endothelial cells express eGFP in the Tg(batf3MIN:eGFP) reporter line. A, Fixed 21 dpf zebrafish (upper panel) was depigmented and cleared to obtain totally transparent fish (bottom panel). B-D, Two-photon lateral images of head from 3, 7, and 21 dpf Tg(batf3MIN:eGFP) zebrafish. Arrowheads indicate facial lymphatics. E, Dorsal images of head from double Tg(batf3MIN:eGFP) x Tg(kdrl:Hsa.HRAS-mCherry) transgenic fish at 7 dpf, F, Schematic diagram of zebrafish head in dorsal view. Red box indicated the region of optic tectum acquired. Maximum projection of the left optic tectum in double Tg(batf3MIN:eGFP) x Tg(kdrl:Hsa.HRAS-mCherry) transgenic fish at 7 dpf. Arrows show thin projections linking GFP expressing cells to each other G, 3D reconstruction of dashed line highlighted region shown on the F right panel. H, Lateral maximum projection of the brain in double Tg(batf3MIN:eGFP) x Tg(kdrl:Hsa.HRAS-mCherry) transgenic fish at 21 dpf. I, Schematic diagram of zebrafish brain in dorsal and lateral view. Red box indicated the region imaged. Maximum projections of a brain region acquired in double Tg(batf3MIN:eGFP) x Tg(kdrl:Hsa.HRAS-mCherry) transgenic fish at 21 dpf. J, Dorsal images of head from Tg(batf3MIN:eGFP) x Tg(lyve1:dsRed2nz101) transgenic fish at 21 dpf. Red box indicated the region of the optic tectum presented in k. K, Upper panel: maximum projection of a region of the optic tectum in 21 dpf double Tg(batf3MIN:eGFP) x Tg(lyve1:dsRed2nz101) transgenic fish. Lower panel: 3D reconstruction region presented in upper panels (batf3MIN), magenta (lyve1) and blue (brain surface). L, Dorsal images of head from Tg(batf3MIN:eGFP) x Tg(mpeg:mCherryF) transgenic fish at 7 dpf. Red box indicated the region of the brain presented in m. M, Dorsal view of a region of the brain in a 7 dpf Tg(batf3MIN:eGFP) x Tg(mpeg:mCherryF) transgenic fish. FB, forebrain; OT, optic tectum; HB, hindbrain |

In the Tg(batf3MIN:eGFP) reporter line, eGFP signal is restricted to a subset of facial lymphatic endothelial cell. A, Lateral view of segmented facial lymphatics in 21 dpf double Tg(batf3MIN:eGFP) x Tg(lyve1:dsRed2nz101) transgenic fish displayed in 3D. B, Schematic diagram of zebrafish facial lymphatics at 21 dpf. C, Schematic diagram of zebrafish head in lateral view. Red box indicated the region acquired. Maximum projection of a portion of facial lymphatics from double Tg(batf3MIN:eGFP) x Tg(lyve1:dsRed2nz101) transgenic fish at 21 dpf. D, Lymphangiogram of a 21dpf Tg(batf3MIN:eGFP) transgenic fish injected with qdots to visualize the facial lymphatics vessels. LFL, lateral facial lymphatics; MFL, medial facial lymphatics; LAA, lymphatic branchial arches; OLV, otolithic lymphatic vessel; PHS, primary head sinus; OB, olfactory bulbs |

Caudal batf3MIN positive vessels co-express BEC and LEC markers. A, Schematic diagram of 3 dpf zebrafish larvae in lateral view. Red box indicated the tail region presented in the right panel. Maximum projection of a 3 dpf Tg(batf3MIN:eGFP) transgenic zebrafish tail showing eGFP signal in CV and at the basis of the ISV. B, Upper panel: maximum projection of a 7 dpf whole Tg(batf3MIN:eGFP) transgenic larvae. Middle panel: schematic diagram of zebrafish larvae in lateral view. Red box indicated the trunk region presented in the right panel. Maximum projection of a 7 dpf Tg(batf3MIN:eGFP) transgenic fish showing eGFP signal in the PCV and at the basis of the ISV. Lower panel: schematic diagram of zebrafish larvae in lateral view. Red box indicated the tail region presented in the right panel. Maximum projection of a 7 dpf Tg(batf3MIN:eGFP) transgenic fish showing eGFP signal in the CV. C, Schematic diagram of 7 dpf zebrafish larvae in lateral view. Red box indicated the tail region presented in the right panel. Maximal projection of a 7 dpf double Tg(batf3MIN:eGFP) x Tg(kdrl:Hsa.HRAS-mCherry) transgenic fish. D, Schematic diagram of 21 dpf zebrafish in lateral view. Red box indicated the trunk region imaged in the right panel. Upper right panels: maximum projection of a 21 dpf double Tg(batf3MIN:eGFP) x Tg(kdrl:Hsa.HRAS-mCherry) transgenic fish. Lower right panels: maximum projection of a 21 dpf double Tg(batf3MIN:eGFP) x Tg(lyve1:dsRed2nz101) transgenic fish. eGFP positive cells were detected in the CV while in the DA fluorescence correspond to signal background. DA, dorsal aorta; CV, caudal vein; ISV, intersegmental vessels |
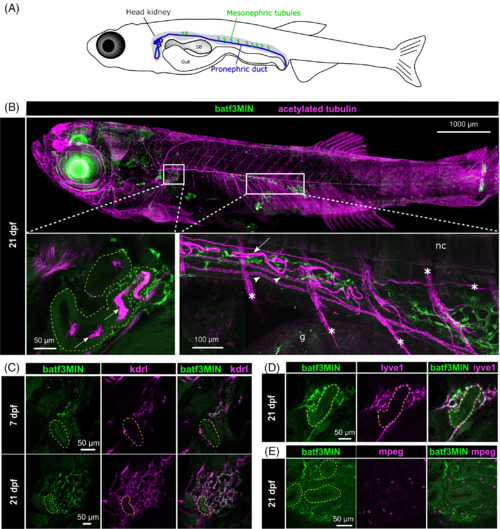
In the kidney, batf3MIN is expressed in an interstitial cell population. A, Schematic diagram of 21 dpf zebrafish larvae showing position of pronephros and mesonephros. B, Upper panel: maximum projection of whole 21 dpf Tg(batf3MIN:eGFP) transgenic fish immunolabeled for eGFP (batf3MIN) and acetylated tubulin antigen (magenta). White boxes indicated the proximal and distal part of the kidney presented in lower panels. Lower left panel: maximum projection of head kidney. batf3MIN:eGFP immunolabeled interstitial cells (green) are located around pronephric duct (dash lines) highlighted by acetylated tubulin staining of cilia (magenta, indicated with arrows). Lower right panel: maximum projection of distal kidney. batf3MIN:eGFP immunolabeled interstitial cells (green) are located around mesonephric ducts (arrows) connected to the pronephric ducts (arrowheads) revealed by acetylated tubulin staining (magenta). Asterisks indicate acetylated tubulin staining of axonal projections. C, Optical slices of head kidney in double Tg(batf3MIN:eGFP) x Tg(kdrl:Hsa.HRAS-mCherry) transgenic fish at 7 dpf (upper panel) and 21 dpf (lower panel). Dash lines indicate the kidney tubules. D, Optical slice of head kidney in double Tg(batf3MIN:eGFP) x Tg(lyve1:dsRed2nz101) transgenic fish at 21 dpf. Dash lines indicate the kidney tubules. E, Optical slice of the head kidney in double Tg(batf3MIN:eGFP) x Tg(mpeg1:mCherryF) transgenic fish at 21 dpf. Dash lines indicate the kidney tubules |

Vascular and lymphatic networks in the head kidney from larvae to juvenile. A, Left panel. Diagram of a 16 dpf zebrafish larvae showing the acquired pronephros region. Right panels: Maximum projection of the head kidney from a double Tg(fli1:GFP) x Tg(kdrl:Hsa.HRAS-mCherry) transgenic fish at 16dpf. Dash lines indicate the kidney tubules. B, Left panel: Diagram of a 22 dpf zebrafish larvae showing the acquired pronephros region. Right panels: Optical sections of two-photon acquisitions of the head kidney from a double Tg(fli1:GFP) x Tg(kdrl:Hsa.HRAS-mCherry) transgenic fish at 22 dpf. C, Left panel: Diagram of a 23 dpf zebrafish larvae showing the acquired pronephros region. Right panel: Angiogram of a 23 dpf Tg(batf3MIN:eGFP) transgenic fish injected with qdots |

SVCV infection disrupts the renal batf3MIN network. A, Maximum projection of in vivo images of Tg(batf3MIN:eGFP) head kidney upon SVCV infection (SVCV) or in control conditions (CTRL). B, Hematoxylin and eosin stain of histological sections from SVCV infected fish (SVCV) and controlled fish (CTRL) performed 24 hpi. Black dashed boxes indicate the region of the kidney presented in the lower panels. Blue arrowheads show cell death |

Tail fin lymphatics are batf3MIN positive A, Maximum projection of tail in double Tg(batf3MIN:eGFP) x Tg(kdrl:Hsa.HRAS-mCherry) transgenic fish at 21 dpf. B, Lateral (left panel) and dorsal (right panel) view of the 3D rendered tail showing the lymphatic heart (green, arrow) associated to autofluorescent muscle fibers (blue) and blood vasculature (magenta). Caudal fin lymphatic vessels were surrounding blood vessels of the caudal fin extending towards the rays. C, Maximum projection of tail in double Tg(batf3MIN:eGFP) x Tg(lyve1:dsRed2nz101) transgenic fish at 21 dpf. D, Schematic diagram of caudal fin lymphatics and blood vasculature in lateral view at 21 dpf |