
|
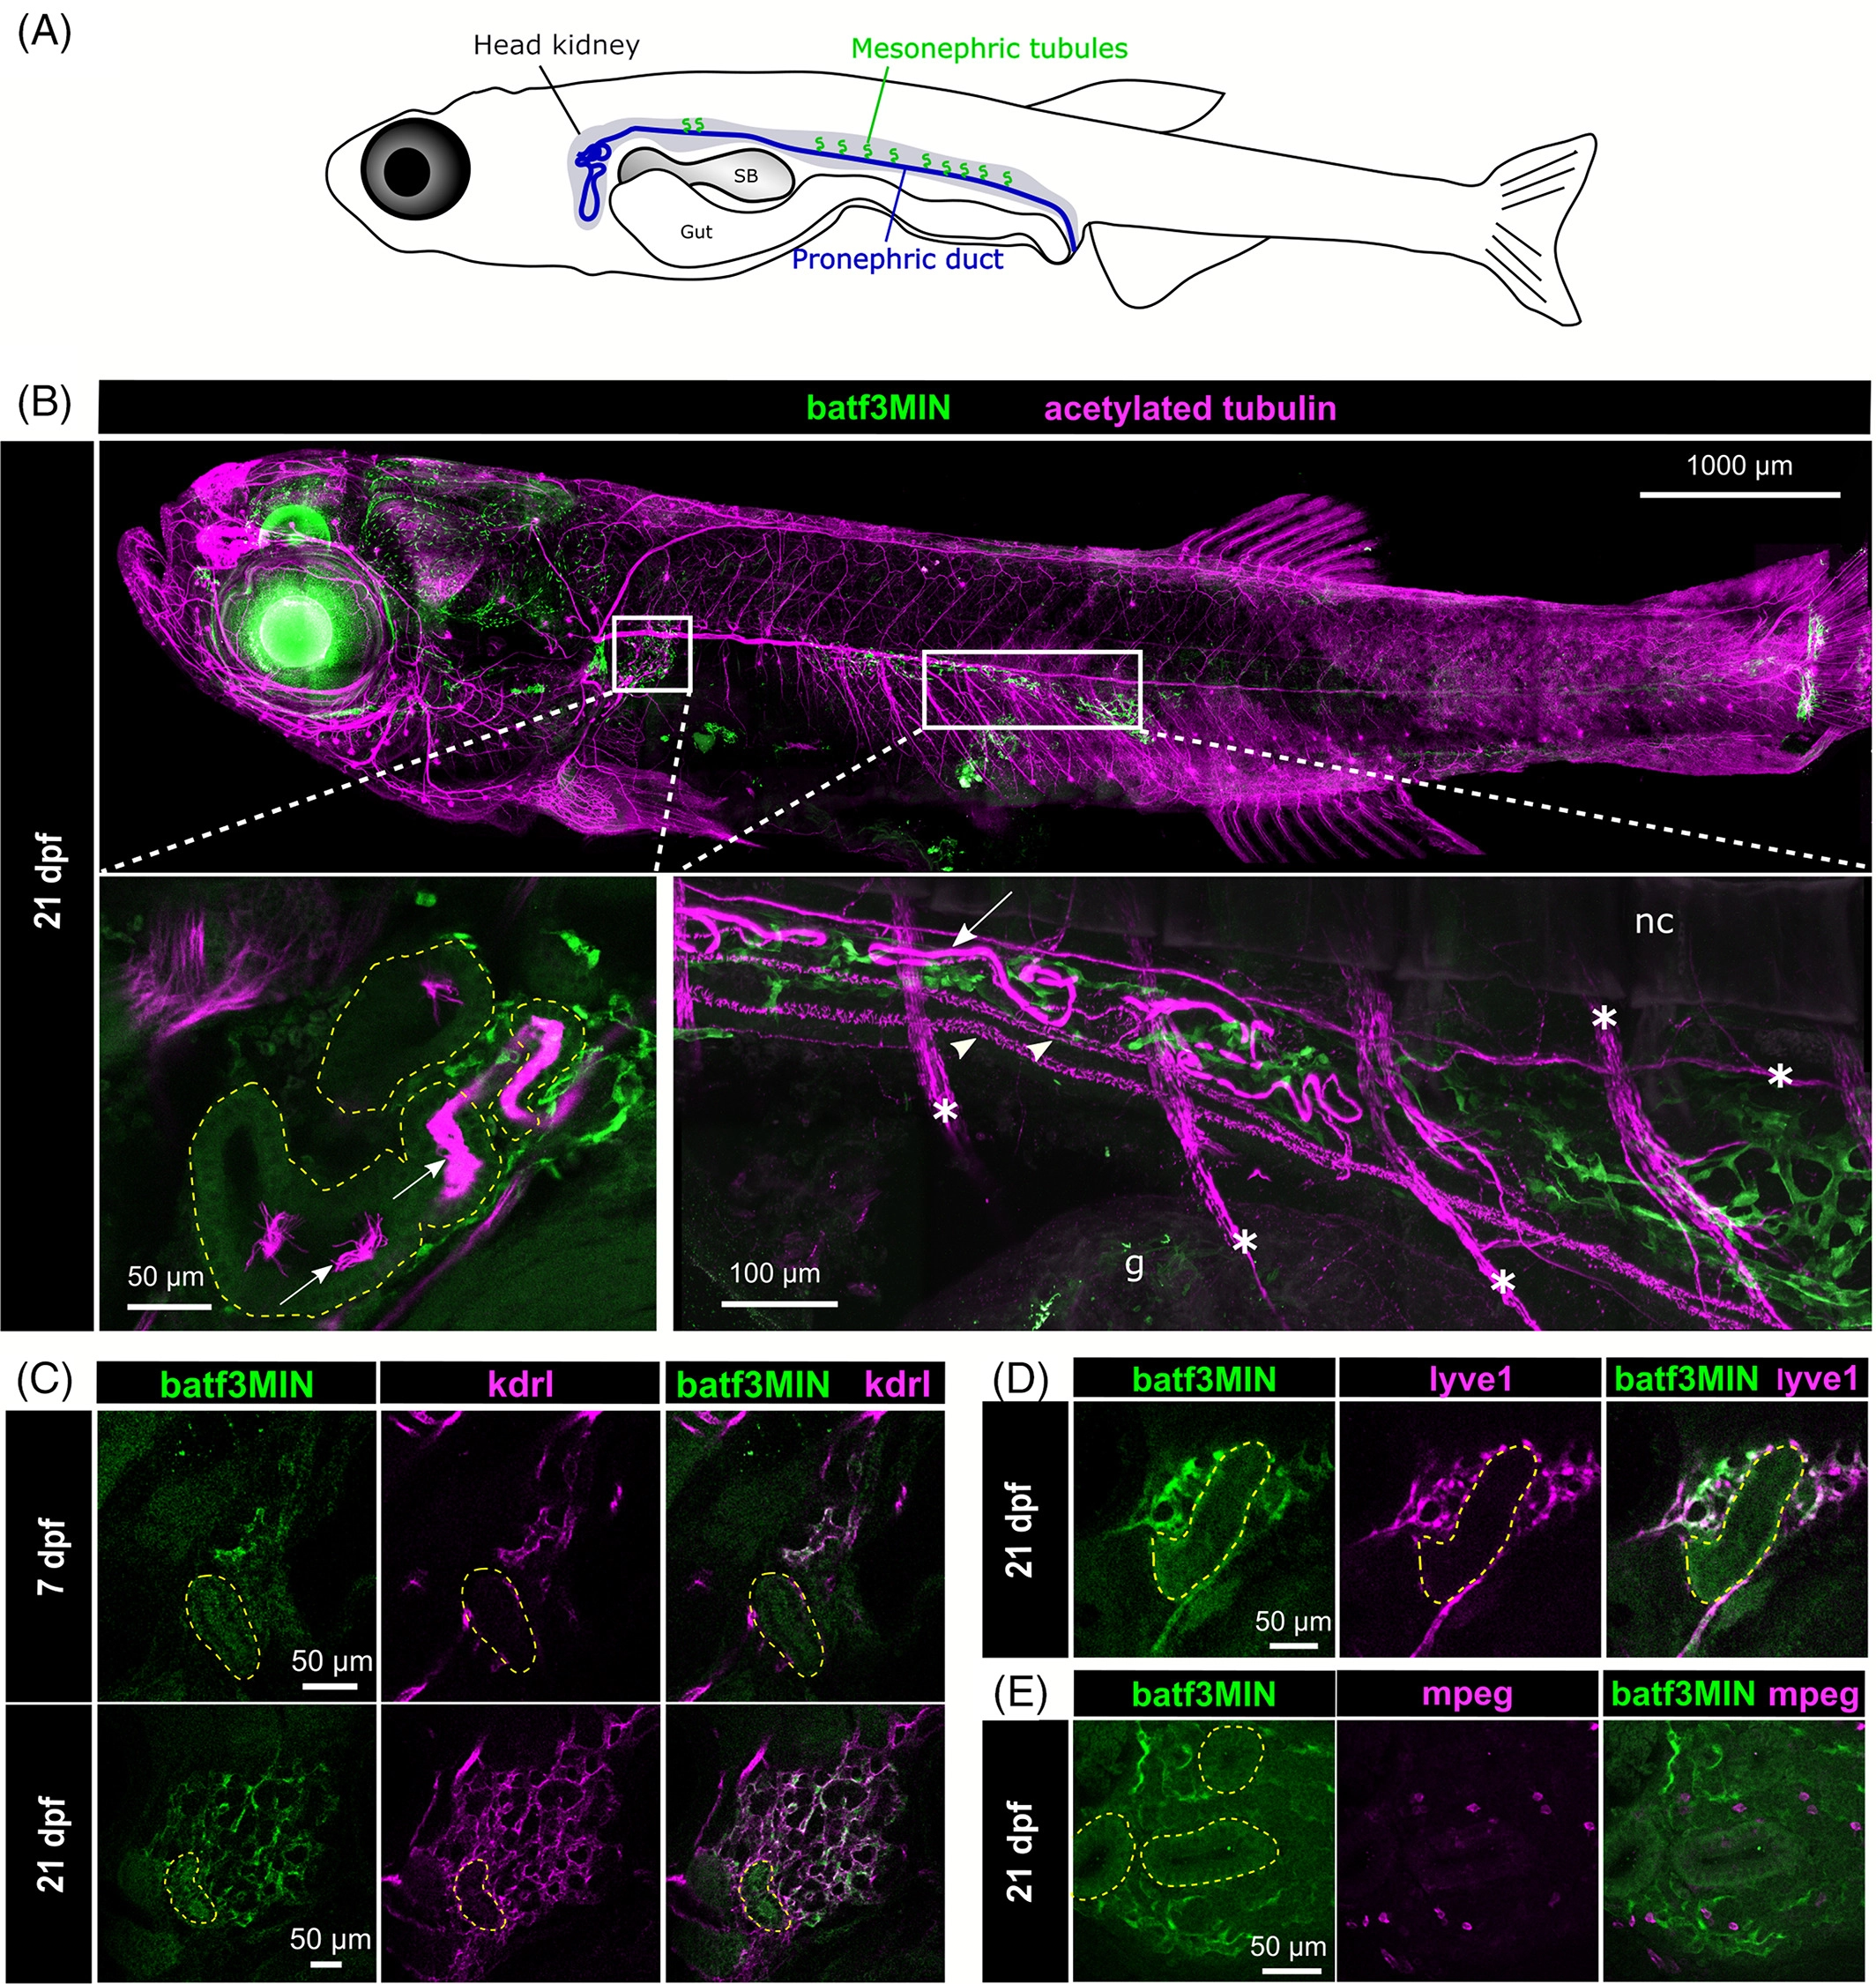
Fig. 5 In the kidney, batf3MIN is expressed in an interstitial cell population. A, Schematic diagram of 21 dpf zebrafish larvae showing position of pronephros and mesonephros. B, Upper panel: maximum projection of whole 21 dpf Tg(batf3MIN:eGFP) transgenic fish immunolabeled for eGFP (batf3MIN) and acetylated tubulin antigen (magenta). White boxes indicated the proximal and distal part of the kidney presented in lower panels. Lower left panel: maximum projection of head kidney. batf3MIN:eGFP immunolabeled interstitial cells (green) are located around pronephric duct (dash lines) highlighted by acetylated tubulin staining of cilia (magenta, indicated with arrows). Lower right panel: maximum projection of distal kidney. batf3MIN:eGFP immunolabeled interstitial cells (green) are located around mesonephric ducts (arrows) connected to the pronephric ducts (arrowheads) revealed by acetylated tubulin staining (magenta). Asterisks indicate acetylated tubulin staining of axonal projections. C, Optical slices of head kidney in double Tg(batf3MIN:eGFP) x Tg(kdrl:Hsa.HRAS-mCherry) transgenic fish at 7 dpf (upper panel) and 21 dpf (lower panel). Dash lines indicate the kidney tubules. D, Optical slice of head kidney in double Tg(batf3MIN:eGFP) x Tg(lyve1:dsRed2nz101) transgenic fish at 21 dpf. Dash lines indicate the kidney tubules. E, Optical slice of the head kidney in double Tg(batf3MIN:eGFP) x Tg(mpeg1:mCherryF) transgenic fish at 21 dpf. Dash lines indicate the kidney tubules