
- Title
-
Modulating glutathione thiol status alters pancreatic β-cell morphogenesis in the developing zebrafish (Danio rerio) embryo
- Authors
- Rastogi, A., Severance, E.G., Jacobs, H.M., Conlin, S.M., Islam, S.T., Timme-Laragy, A.R.
- Source
- Full text @ Redox Biol.
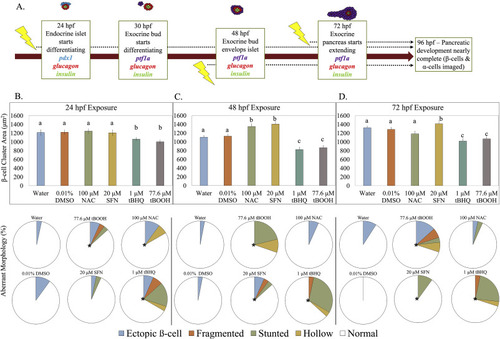
Fig. 1. β-cell cluster area is impacted by redox modulation at critical windows of exposure. (A) Schematic of zebrafish pancreatic development and exposure paradigm. [pdx1 – transcription factor in pancreatic progenitor cells; glucagon – hormone secreted by α-cells; insulin – hormone secreted by β-cells; ptf1a – transcription factor present in exocrine pancreas] (B) β-cell cluster area in Tg(insa:eGFP) zebrafish at 96 hpf following a short exposure to the stated redox modulating chemical at 24 hpf then raised in clean conditions (n = 30 fish). Below, classification of aberrant islet morphologies. (C) β-cell cluster area at 96 hpf following exposure to the stated redox modulating chemical at 48 hpf (n = 37 fish). Below, classification of aberrant islet morphologies. (D) β-cell cluster area at 96 hpf following exposure to the stated redox modulating chemical at 72 hpf (n = 34 fish). Below, classification of aberrant islet morphologies. Different letters represent significant differences from the control. Different letters indicate significant differences (p < 0.05) as determined by a ONE-WAY ANOVA followed by a Fisher's LSD Post-Hoc Test. *p < 0.05 as determined by a Chi-square test. |
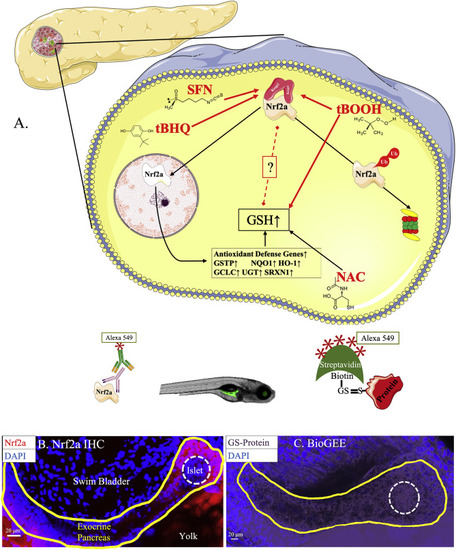
Fig. 2. Endocrine pancreas has lower antioxidant defenses. (A) Schematic of all the Nrf2a redox modulators used in this study. (B) Nrf2a expression in pancreatic head and neck of 96 hpf zebrafish embryos (n = 23 fish). (C) Protein glutathionylation in pancreata of 96 hpf zebrafish embryos (n = 13 fish). Solid lines denote exocrine pancreas, dashed lines denote endocrine pancreas. |

Fig. 3. Pancreatic Nrf2a expression and protein glutathionylation patterns in response to tBOOH exposure. (A) Exposure paradigm. (B) Potential mechanism for tBOOH-mediated changes in Nrf2a and protein glutathionylation. (C) Nrf2a and protein glutathionylation patterns in pancreata of fish exposed to stated treatments. Solid lines denote exocrine pancreas, dashed lines denote endocrine pancreas; representative images from 10 to 14 fish. Scale bars represent 20 μm. Grayscale split channel images of the Nrf2a immunohistochemistry are provided in Supplementary Fig. 2, and BioGEE immunohistochemistry in Supplementary Fig. 3. |

Fig. 4. Pancreatic Nrf2a expression and protein glutathionylation patterns in response to tBHQ exposure in zebrafish embryos. (A) Nrf2a protein and (B) protein glutathionylation patterns in pancreata of fish exposed to 1 μM tBHQ from 48 to 54 hpf. Solid lines denote exocrine pancreas, dashed lines denote endocrine pancreas; representative images from 11 to 14 fish. Scale bars represent 20 μm. Grayscale split channel images of the Nrf2a immunohistochemistry are provided in Supplementary Fig. 4, and BioGEE immunohistochemistry in Supplementary Fig. 5. |
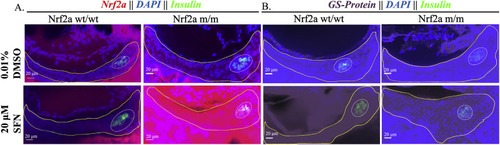
Fig. 5. Pancreatic Nrf2a expression and protein glutathionylation patterns in response to SFN exposure in zebrafish embryos. (A) Nrf2a protein and (B) protein glutathionylation patterns in pancreata of fish exposed to 20 μM SFN from 24 to 48 hpf. Solid lines denote exocrine pancreas, dashed lines denote endocrine pancreas; representative images from 11 to 13 fish. Scale bars represent 20 μm. Grayscale split channel images of the Nrf2a immunohistochemistry are provided in Supplementary Fig. 4, and BioGEE immunohistochemistry in Supplementary Fig. 5. |
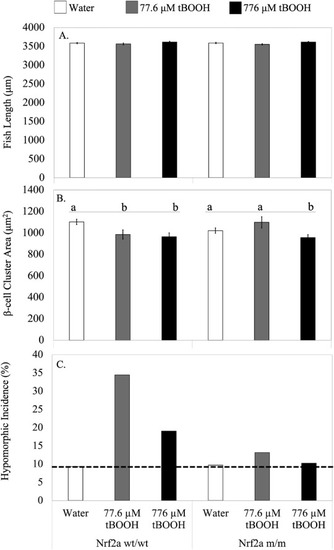
Fig. 6. Nrf2a is essential for redox dependent disruption of β-cell morphology. Nrf2a wt/wt or Nrf2a m/m fish were exposed to water (n = 70 fish), 77.6 μM tBOOH (n = 32 fish) or 776 μM tBOOH (n = 35 fish) for 10 min at 48 hpf and their length (A), β-cell cluster area (B) and incidence of hypomorphic islets (cutoff represented by dashed line) (C) were measured at 96 hpf. Different letters indicate significantly different means across indicated group. p < 0.05 compared to respective control as determined by a 1-way ANOVA followed by a Tukey-Kramer post-hoc. |