
Fig. 1
- ID
- ZDB-IMAGE-210222-50
- Genes
- Publication
- Rastogi et al., 2020 - Modulating glutathione thiol status alters pancreatic β-cell morphogenesis in the developing zebrafish (Danio rerio) embryo
- All Figures
- Figures for Rastogi et al., 2020
|
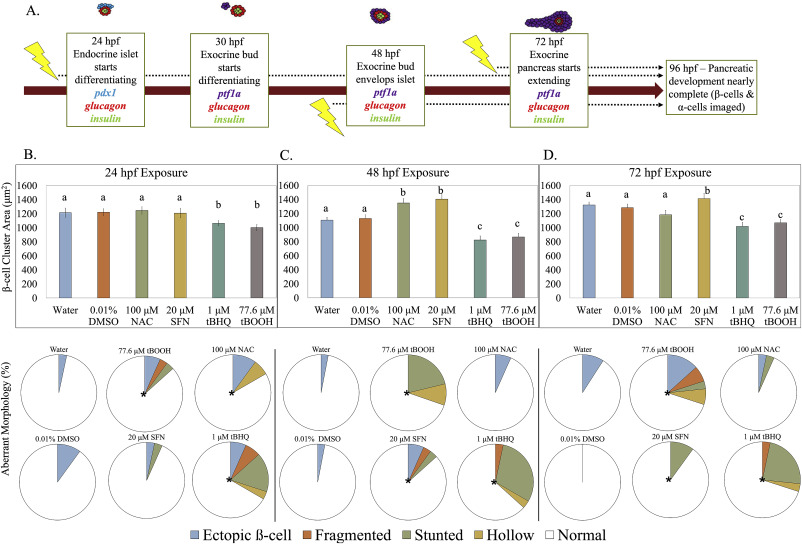
Fig. 1 Fig. 1. β-cell cluster area is impacted by redox modulation at critical windows of exposure. (A) Schematic of zebrafish pancreatic development and exposure paradigm. [pdx1 – transcription factor in pancreatic progenitor cells; glucagon – hormone secreted by α-cells; insulin – hormone secreted by β-cells; ptf1a – transcription factor present in exocrine pancreas] (B) β-cell cluster area in Tg(insa:eGFP) zebrafish at 96 hpf following a short exposure to the stated redox modulating chemical at 24 hpf then raised in clean conditions (n = 30 fish). Below, classification of aberrant islet morphologies. (C) β-cell cluster area at 96 hpf following exposure to the stated redox modulating chemical at 48 hpf (n = 37 fish). Below, classification of aberrant islet morphologies. (D) β-cell cluster area at 96 hpf following exposure to the stated redox modulating chemical at 72 hpf (n = 34 fish). Below, classification of aberrant islet morphologies. Different letters represent significant differences from the control. Different letters indicate significant differences (p < 0.05) as determined by a ONE-WAY ANOVA followed by a Fisher's LSD Post-Hoc Test. *p < 0.05 as determined by a Chi-square test.